 Many Visio users discover how to insert fields into the text of Visio shapes to display data contained in Shape Data fields. But they become frustrated when they add multiple text blocks to grouped shapes, as the process becomes more tricky. Let’s take a look at how to do this!
Data Graphics
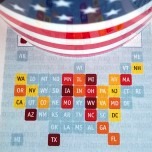
USA States Map with Equal-sized States
The states in the USA are all over the map when it comes to total area (aka, “size”).
We all love data visualizations on maps, but the wide range of state sizes can distort visual messages.
facebook Like Data Graphic (Thumbs Up!)
 Yay! It’s the weekend! Everyone’s checking facebook to see where Friday beer garden will be. And even if you’re not a facebook user, news of their IPO has surely crossed your browser. Ah, another bunch of filthy rich, young nerds in the valley! Enjoy those expensive Lego Technic and Mindstorms kits you can now afford, guys. You’ve earned them!
“But Visio Guy”, you may ask, “what does this have to do with Visio?”
World Cup 2010 in Visio…and SharePoint!
 If you’re a visual type who loves Visio, and are excited or interested in Visio Services for SharePoint 2010, then you’ll want to check out this on-line example that shows off both of them in action!
It looks like Microsoft have linked World Cup 2010 data to Visio diagrams. Then they rather slickly published the diagrams to a SharePoint site using Visio Services (as far as I can tell)
Interactive, up-to-date diagrams, created with your favorite diagram-authoring tool and brought to life by the SharePoint portal platform.
Come on in and see what your favorite team is up to!
Turn It Up With the NW Airlines Volume Gauge!
 The last time I flew the Amsterdam to Seattle route on Northwest Airlines, I noticed an interesting graphic while trying to figure out how to watch a movie with the in-flight entertainment system.
The graphic showed a clever way to squeeze more steps into a gauge-graphic without using more space.
Of course I couldn’t resist turning it into a Visio SmartShape. You can download it here and use it your presentations and documentation to show ratings, status, priority or other relative data values that will pop off the page when illustrated visually!
[Read more…] about Turn It Up With the NW Airlines Volume Gauge!
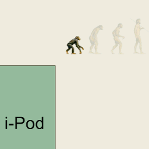
Ape to Man Data Graphic
Visio Film Strip Shapes: Hurray for Hollywood!
 Multi-shape capability is one of the qualities that make Visio SmartShapes something special. A single shape can alter its appearance at the click of a context-menu, or the change of a data value.
While Visio shapes are often vector based, you can also create Visio multi-shapes using images. Using the simple panning-and-cropping technique described in this article will help you to quickly build efficient image-based Visio multi-shapes! So if you have a set of icons just aching to become a SmartShape, read on!
[Read more…] about Visio Film Strip Shapes: Hurray for Hollywood!
Forefront Icons and Data Graphic Shapes
![]() If you are using Microsoft Forefront Client Security, and are documenting it in your Visio network diagrams, or if you dig Visio’s new Data Graphics features, or simply like brightly-colored, shiny new Visio shapes and then we’ve got an article and a download for you!
If you are using Microsoft Forefront Client Security, and are documenting it in your Visio network diagrams, or if you dig Visio’s new Data Graphics features, or simply like brightly-colored, shiny new Visio shapes and then we’ve got an article and a download for you!
Data Graphics Resources
 Visio 2007 has many cool new features, and among the coolest are Data Linking and Data Graphics. These data features allow shapes to link to data-sources and graphically react to it. You can also add Data Callouts as adornments to existing shapes. The callouts display data next to a shape without visually changing the actual shape.
Of course, if you’re a Visio Guy like me, you won’t be content to sit back and use the pre-built Data Graphics supplied by The Man. You’ll want to roll up your sleeves and create your own, thank you very much.
So I’ve scoured the net to find resources that contain the nitty-gritties about Data Graphics. Have a look, and stay up all night!
12 Month Data Graphic Shape (almost)
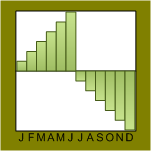 This morning I was thumbing through one of Edward R. Tufte’s books, and I got this idea for a “12-month bar shape” — a shape that shows vertical bars for each month of the year, in a compact, easy-to-read format. My original thought was that it would make a perfect Visio 2007 Data Graphic!
So, without thinking, planning, or researching, I plunged ahead creating the details of the shape, and then realized that making a Data Graphic is more complicated than I thought. Ugh!
Nevertheless, I’ve created a shape, which displays bar-graphics for 12 months of the year, and which links to external data. Perhaps you’ll find it useful!
