 I’ve been playing with Visio 2007’s new Data Graphics features more and more lately, and have been getting all sorts of ideas for new Data Graphics to share with Visio Guy readers.
One day, I was staring at the Ratings Data Graphic Item that ships as one of Visio’s standard Data Graphic elements…

The neurons in my brain fired, got lost underway, and triggered a memory of this old classic:
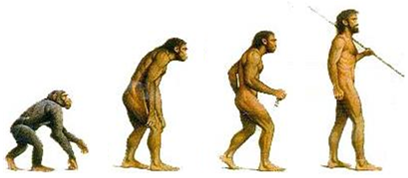
Thus, the genesis for a new Visio Guy article was born…
The Dawn of a New Data Graphic
I’d love to describe every detail about how this data graphic is constructed, but it would make for a very lengthy article, and would likely get you in trouble with your boss for burning up too much time at the office. So let’s just hit the highlights.
Two Images are Better Than One
One of the interesting things about this data graphic item is that it uses two images to get the job done.
One of the images has 0% transparency, and the other has 85% transparency. Smart formulas in each shape’s ShapeSheet cleverly control the cropping of the image so that we see the appropriate bits of the opaque image and the transparent image.
We can see this cropping in action in the illustration below. The two images are separated for clarity, but they normally live on top of each other.
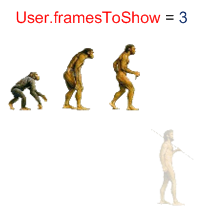
Each image-shape has a special ShapeSheet cell to control how it is cropped. This cell is called: User.framesToShow. This user-cell references the standard data graphic item cell: User.msvCalloutIconNumber. User.msvCalloutIconNumber is written to by Visio, depending on the value of the field in the cell, and how the data graphic is defined.
The illustration shows how the image-cropping reacts when 3 image-elements are to be shown.
Equal Spacing Under God
An important step in creating the icon set was to make sure that the graphical elements were equally spaced. In the original artwork, they are not.

To create this equally-spaced version of the art, I did this:
- Imported the graphic into Visio
- Created four copies
- Cropped each of the four shapes to show one of the elements
- Made the width of each shape equal
- Positioned the shapes next to each other
- Selected all four shapes
- Exported the selection as a new image
Once the equally-spaced bitmap was created, I messed around with an image-editor to create a transparent background. The data graphic looks a lot better without a white background–especially when your diagram has a colored background, like in the example at the end of the article.
I was surprised to find that Visio 2007 handled .gif files with transparent backgrounds. But even Visio 2003 supports transparent-background .GIFs. Somehow I’ve missed this capability over the years!
Ape to Man Data Graphic in Action
The download-able Visio file at the end of this article includes the Ape to Man Icon Set and a ready-to-use Ape to Man Data Graphic that you can apply to your shapes.
Since data graphics need to link to data fields, I’ve added four special flowchart shapes to the document. Each shape has an extra data field called Difficulty. Prop.Difficulty can have the values: Freshman, Sophomore, Junior, Senior.
The Ape to Man Data Graphic is mapped to the distinct values of this Difficulty field, which graphically represent the evolutionary level required to complete the given tasks.
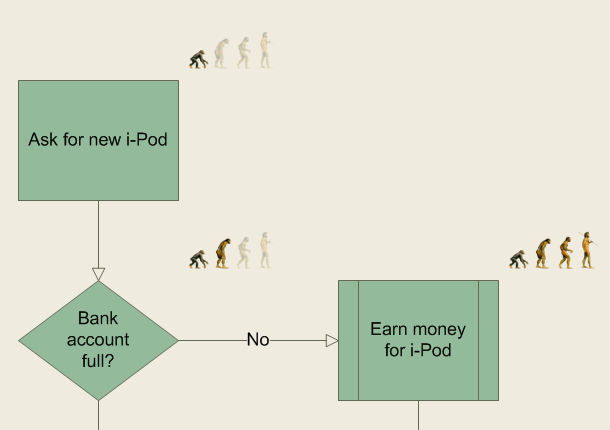
click to view larger image
Since the file includes the Ape to Man Icon Set, you can create your own Data Graphics that map to other fields in your diagrams!
Download “Ape to Man Visio Data Graphic”

Dude, that’s fantastic!!! Great job!
Chris,
Good to see you’re still providing mission-critical business solutions.:-)
Thanks,
Ole