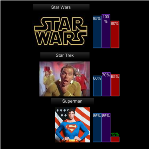
Today, we continue with the movie-trilogy theme, but concentrate on advanced tips for importing and working with multiple shapes automatically.
This is the third and final piece in our trilogy of articles on Visio data graphics and data-linking.
Smart graphics for visual people

Today, we continue with the movie-trilogy theme, but concentrate on advanced tips for importing and working with multiple shapes automatically.
This is the third and final piece in our trilogy of articles on Visio data graphics and data-linking.
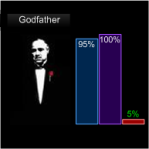 Today we’re going to talk about adorning Visio shapes with data graphics, and the extreme flexibility that Visio data graphics offer.
This is slightly different than what we discussed previously in Trilogy-meter Data Graphics Part I. In that article, we linked data to shapes that were built specifically to be info-graphics.
This time around, we’ll apply info-graphics to shapes that already exist…and we’ll stay out of the ShapeSheet while we are doing it!
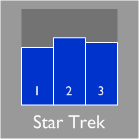
Today, Visio Guy will show you how to create a three-bar SmartShape and link it to data using Visio 2007 Professional’s brilliant “Link Data to Shapes” feature.
We’ll cover the intricacies of creating a shape that visually reacts to data, and show you how to link instances of this shape to actual rows of data in an Excel spreadsheet!
This is the first in a three-part series on data graphics and data linking, so read-on, and stay tuned!
 In your quest to create a Visio-based application you’re not likely to find yourself stranded on a Visio-based-island. You’ll probably find yourself strolling through a land filled with other software products that need to join you on your journey.
So if your wanderings take you through the towns of Access, Excel, Active Directory, SQL Server, MOM, Exchange, Reporting Services, or SharePoint, then you’ve stopped at the right place to get directions!
The good citizens at Visimation have authored eight — that’s E-I-G-H-T-! — articles to guide you on your path towards integrating Visio with Microsoft technologies…
[Read more…] about Integrating Visio 2007 with Microsoft Technologies
 Visio 2007 has many cool new features, and among the coolest are Data Linking and Data Graphics. These data features allow shapes to link to data-sources and graphically react to it. You can also add Data Callouts as adornments to existing shapes. The callouts display data next to a shape without visually changing the actual shape.
Of course, if you’re a Visio Guy like me, you won’t be content to sit back and use the pre-built Data Graphics supplied by The Man. You’ll want to roll up your sleeves and create your own, thank you very much.
So I’ve scoured the net to find resources that contain the nitty-gritties about Data Graphics. Have a look, and stay up all night!

Hello Visio Fans! I received a Visio Partner e-mail a few days ago that contains a fabulous set of links to Visio How-To demo videos.
The demos cover new Visio 2007 topics such as DataGraphics, Themes, AutoConnect, PivotDiagrams and Vista integration.
 So Visio 2007 has been released, and…well…I’d love to say that I’ve been pounding the pavement, doing a ton of research, and have dug up the latest scoop, but the guys over at Visio Insights have written a nice post entitled: What’s so great about Visio 2007? that anyone’d be hard pressed to beat.
There’s some nice screenshots of the new datagraphics and pivot charts that are available in the new version, as well as links to Visio 2007 new-feature videos and other online resources. So go on over and have a look, and tell ’em Visio Guy sent you!
 I’m getting more and more questions daily about the soon-to-be-released Microsoft Office Visio 2007. Evidently, the final bits for the Office 2007 system have been released to manufacturing, but the products won’t be available ’til early 2007.
For now, however you can play with beta 2, and check out the latest Visio 2007 product information in the following paragraphs…
[Read more…] about Visio 2007 General Information #1