 A Sankey diagram is an interesting visualization that uses the thickness of arrows to depict the flow-volumes in a system. The thicker the arrow, the more flow of energy, mass, or volume. Sankey graphics are easily read and quickly comprehended.
In this article, we’ll explore the creation of Sankey diagrams using Visio, and we’ll offer our own free Visio Sankey diagramming shapes for your downloading and diagramming pleasure!
What do Sankey Diagrams Look Like?
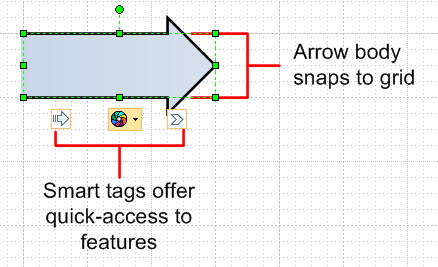
You can see many samples of Sankey diagrams by image-searching for “Sankey Diagram” on Google or MSN. You’ll see hundreds of colorful examples that will make you want to start diagramming right away! MSN’s Live Search offered these at the top of the result list:
If you work in any kind of industry in which material- or energy flow is important, or are working on environmental issues, then you’ll surely want to pull a Sankey diagram out of your hat at that next departmental meeting!
Can Visio do Sankey?
While there are no Sankey Diagrams templates that ship with Visio, there are a few in-the-box shapes that can be used to create rudimentary Sankeys.
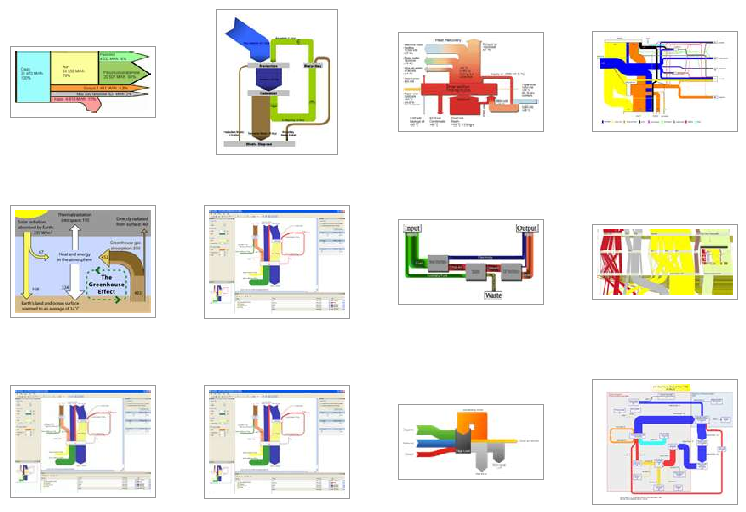
Visio’s Block Diagram Template and Blocks stencil have shapes that you can use to create Sankey diagrams. Here we can see the Block and Arrow shapes at work in an oversimplified visual of an oil-combustion process:
A nice feature of the arrow, is that you can right-click the shape, and choose to have an open- or closed tail. This makes the outputs look better, as they blend nicely with the process box.
The alignment box (green handles) however, doesn’t match the body of the shape. And since the arrow-thickness is of primary importance in a Sankey diagram, it would make sense to have the body of the arrow exactly match the height of the shape. The arrow head “flanges” are superfluous, and could be outside of the box, so to speak.
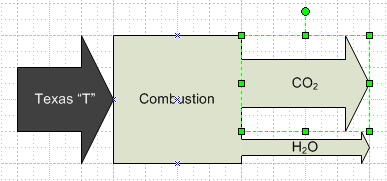
Another problem comes when the arrow is lined up with the edge of the process box. When the tail is open, there is a little tab that sticks out and covers up the edge of the process box. The Visio-supplied arrow doesn’t quite get it right, as we can see when we zoom in:
Visio Guy Does Sankey
We’ve made a new version of the arrow shape which is more suitable to making Sankey diagrams. You can download it at the end of this article and give it a whirl!
There are improvements to the existing shape’s features, plus a few additions to make your Sankey-ing more pleasurable…
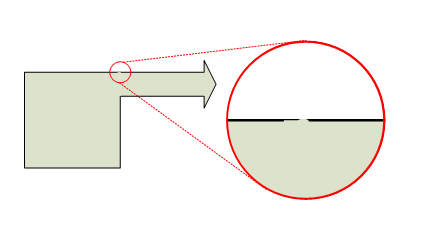
First, the alignment box matches the thickness of the arrow, so you can more directly control the “size of the flow”. It also makes it easier to position the arrow relative to the process box or other flow arrows.:
You’ll also notice the curios icons floating below the shape. These are Smart Tag menus that allow quick access to the shape’s features. You can also right-click the shape and gain access to all the features, but the Smart Tag menus are shorter and clearer, since they are divided into three groups for: Tail behavior, formatting, and arrowhead behavior.
Arrow Features
When you right-click the arrow shape, you’ll see a dizzying array of features, which we’ll visually illustrate here:
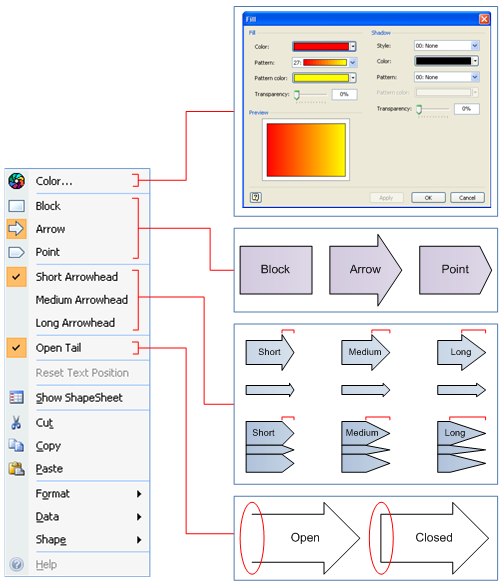
The features allow you quick access to the Fill Format dialog, three styles of arrowhead, three lengths of arrowhead, and the choice to open or close the tail of the arrow.
Blended Colors
The Color… menu item makes it easier and quicker to change the fill colors, so you can create interesting effects like this:
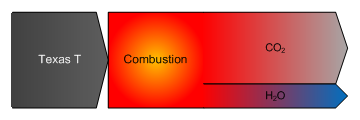
You can see that setting the Arrowhead Style to Point makes it easier to stack the arrows next to each other for a more compact diagram. It’s also easier to see that the ratio (by mass) of carbon-dioxide is roughly three times that of water in the combustion process. (I forgot to show air as an input, by the way…)
Arrowhead Aspect Ratios
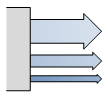
One note about the arrowhead styles. When the style is Arrow, the arrowheads resize proportional to the body size. This ensures that the arrowheads maintain the same aspect ratio, and keeps the diagram’s appearance clean:
When the arrowhead style is Point, however, the arrowhead length stays constant. This looks better when the arrows are stacked together:
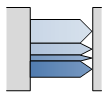
It’s a fine point, if you’ll pardon the pun, but it’s one that you don’t notice until its done wrong!
Sankey Diagram Resources
Sankey Diagrams on Wikepedia. Always a good place to start for definitions and links to other resources.
Sankey-Diagrams.com A person named Phineas runs this site and claims that A Sankey diagram says more than 1000 pie charts. Phineas loves Sankey diagrams and has created a whole blog about them. He breaks down the various types of Sankeys and analyzes diagrams that appear in the wild. Very interesting and informative.
e!Sankey A $100 software product which is dedicated to creating Sankey diagrams. You can download a trial version and give it a test drive! e!Sankey is the younger brother of the more fully-functional Umberto, which is a complete management system for modelling, calculating, and visualizing energy flow systems.
Sankey Helper is a free tool that creates Sankey diagrams in Microsoft Excel. This makes a lot of sense, since the flow-data for your system likely lives in a spreadsheet already!
Sankey Editor is another offering, from developers in Arnold Schwarzenegger’s lovely home town of Graz, Austria.
Sankey Diagram Software list I just found this great list of Sankey-related software from our Phineas over at sankey-diagrams.com.
Download “Sankey Diagram Shapes for Visio”
s!Aj0wJuswNyXlhg0YKR2OrMzukCPt – Downloaded 17266 times – 103.00 B
Love the ‘blah’ placeholder!
Jerry,
I knew it was a mistake to push the “Publish” button before I had finished that last paragraph! Check back soon for the download…
Cheers,
Chris
This looks like a great response to elmoablaze and Paul Herber’s post in the microsoft.public.visio.general newsgroup. Paul had pointed out making a Sankey diagram in Excel at http://www.doka.ch/sankey.htm. Seeing Visio experts post tutorials in response to the newsgroup speaks volumes of the quality of people in the Visio community. Keep up the great work, I appreciate the insight.
Best Regards,
Joe Mako
So how about using a 1-D shape is the lines can be bent? 😉
Or, is the presence of http://www.visguy.com/products/sankey/ an indication that you plan to add more gems on this subject?
Hi John,
You have a sharp eye, sir!
Thought I’d see what the response is to this post, and the user-comments and feedback, then perhaps develop something more sophisticated for Visio. It certainly seems to be something that Visio could use.
– Chris
Not to nit pick here…but if some shape designer is going to go to the trouble of all this intelligence then
why not enforce arrow size vs % of whole…ie custom properties (say 10) and let user put in % with 0% meaning not present. Use the percentage to determine arrow thickness and location. I bet this could be done without any VBA even (seen similar done on other shapes).
Ie why not make a shape that is a a square with arrows coming out to the right based on above parameters?
Hi Ted,
You’ve nailed the next step here. But I think it would be hard to accommodate all the permutations in pre-built shapes. How many inputs? How many outputs? What colors? Do they come in from the sides or tops, do they exit from the sides or bottoms? Are the arrows straight or curved? And so on.
I’m pretty sure that a proper, full-blown solution would utilize at least some code, if nothing else, for decent data-input dialogs, etc.
Also, I think there are plenty of folks that want to get a quick Sandkey diagram drawn. That is, approximate, illustrative diagrams. That means not restricting everything to numbers, but allowing quick, manual resizing.
I’ve been playing with a bunch of ideas, but frankly, the complete solution is too much work for a give-away 🙂
Thanks for the input, though,
– Chris
I have to say, although this has naught to do with the Visio Sankey tool itself: The classic, archetypal example of such a diagram, predating Captain Sankey’s by 29 years, is Minard’s 1869 diagram of Napoleon’s troops advancing on (and then retreating from) Moscow in 1812-13. See http://www.edwardtufte.com/tufte/minard. The width of the trunks represents the number of soldiers (not mass, energy, or volume). Edward Tufte, master of graphical portrayal of information, discusses Minard’s diagram in his 1983 book The Visual Display of Quantitative Information and sells small posters of Minard’s diagram. Or, you used to get one if you took Tufte’s class. (I am not affiliated with Tufte; just a fan of his work.) I have been making such diagrams by hand occasionally in PowerPoint and calling them “Napoleon charts” for lack of a better term since I took Tufte’s class years ago. Thanks for cluing me in to the real name!
Hey Dahveed,
Thanks for the link to that diagram. I know it well, but had no idea what it was called, or who drew it. One of these days I’ll have to create a Napolean’s-march SmartShape 🙂
Cheers,
– Chris
Sorry if this is a dumb question, but how do you link the arrows to the process block? If I use the stencils, they are unlinked at first. I saved one of your sample sankeys as a shape but when I use it the %s seem to be locked in. Thanks.
Hi Leo,
It’s just a matter of abutting them. There’s no automatic connection or glue. If you create a Master in the Stencil by dragging a whole bunch of shapes to the green window on the left, Visio groups them all together. Ie: you can’t have a master that drops as separate shapes.
You can drop your shape, then ungroup it (Ctrl + Shift + U)
Hello Chris,
first of all I have to thank you for your work. I’m busy on a Bachelor Thesis about in-company material flow. And your visio shapes give me great assistance on my work.
But I have a little problem with them. I cannot change the pattern of the arrows. Every time I try to apply for example pattern 02 it switches back to pattern 27.
But it works with the processes. Is it a Problem with your shapes or with my software?
Thank you in advance for your help
Hi Chewie,
The fill patterns are guarded on purpose to enable the fill to flow from one color to another.
If you want to break it, open up the ShapeSheet and get rid of the “GUARD(…)” around the value in the FillPattern cell.
now I’ve got it…. Thank you Sir
I downloaded the Sankey Diagrams Shapes file for Visio. How does one import these into the rest of Visio? I can’t get to the template / Sankey stencil when I open a new Visio document. I can only play with the example page (and it won’t let me delete the header).
Hi Jerry,
Just copy and paste them. I don’t provide separate stencils, just sample drawings. But it’s easy enough to add the shapes to your own stencils.
I looked for Sankey-Visio stuff a couple years ago and never found this post. It’s promising.
Honestly, if I found Visio shapes that could do Sankey diagrams where the arrows could bend and stretch while maintaining their specified width, I would happily fork over real money for it. I will give your downloads a try!!!
Excelente!
You’ve made my life easier
gracias!
Dear Visio-Guy,
i´ m just finishing my bachelor-thesis and i have to admit:
i fell in love with you!
I was using the Sankey arrow a lot in Visio 2010 and older. Now I moved to Visio 2013 and 2016 and I have problem with the color. I can get a gradient on them.
Any help on this?