 I just found a great video that showcases a new feature where Visio organization charts are automatically built and updated within Excel, using Excel data!
Fellow MVP and Excel expert Leila Gharani has produced an excellent video that is not too heavy and not too light. It is concise, really well-done, and shows you exactly what you need to know.
I’ve been remiss in covering the Data Visualizer (it’s been a busy year…), but essentially Microsoft is starting to create tools that can create and update particular Visio drawing types automatically. Yes, we’ve had data graphics for many years, which can be linked to data sources that change. Data graphics allow text, colors and icons to update inside of Visio shapes when linked data changes. But they are a per-shape feature. You don’t get new shapes when new records appear, and shapes don’t get deleted when records go away (although there are some notifications to help in these areas though!)
Data Visualizer takes the next step by creating whole systems of shapes (aka “diagrams”!) that are linked to data. That means shapes get added or deleted along with records, and shapes get connected and arranged according to that data. This is not only seriously cool, but it will save you hours of drudgery!
Some Highlights
- You don’t need a Visio subscription if the org-chart is embedded in Excel.
- However, you do need to have Excel for Office365.
- If you do have Visio you can open and edit the drawing in Visio Online or Visio Desktop, but this is not shown in Video.
- New employees are added automatically, deleted employees are removed, and reassignments are redrawn and reconnected. It is pretty cool to watch!
- Data Visualizer has been around for awhile, but the org-chart stuff is a new addition to basic flowcharts and cross-functional “swimlane” flowcharts and
But watch it for yourself!
Some Org-chart Data Visualizer Screenshots
A few interesting visuals, for those of you just skimming this article.
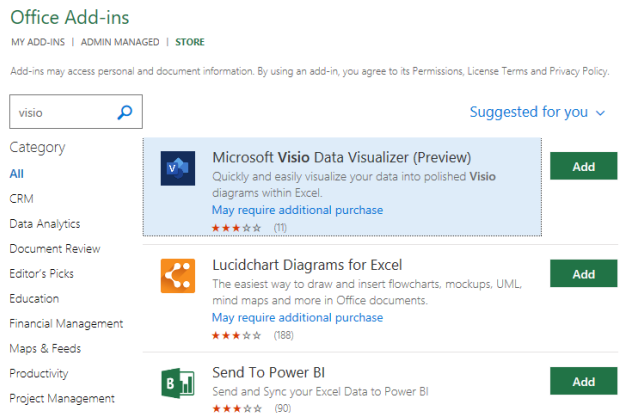
You add a Data Visualizer component to your Excel worksheet via: Home > Add-ins > Get Add-ins:
Once you’ve allowed the add-in, it will be available under: Home > Add-ins > My Add-ins.
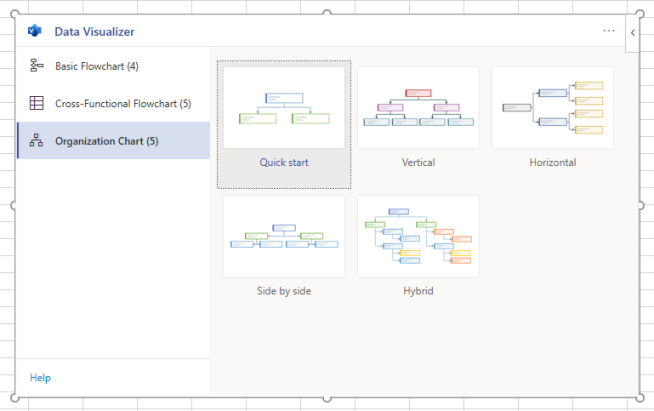
Then you can pick which type of Data Visualization you want: Basic Flowchart, Cross-Functional Flowchart, or Organization Chart. Once you’ve chosen the diagram type, you’ll be offered several styles for the chart:
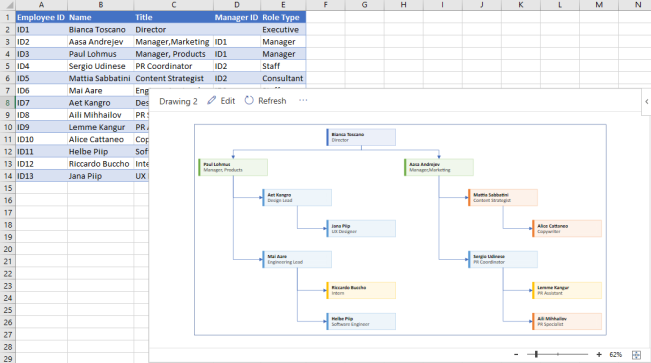
If you pick an org-chart, you will immediately get a chunk of sample data, and the associated diagram. You can then play with adding, removing or changing that data. Click Refresh in the diagram to have it update. Of course, you can copy and paste your own company’s data into those columns, but it’s easiest to start with the sample data and modify it:
I didn’t attempt to customize the fields and get the add-in to respect “my organization’s data format”. I’m not even sure if that is possible at this point. But massaging your data to fit the template is probably easier (at this point) than trying to force the tool to read your data.
A neat feature is the color-by-value that is applied to the positions, according to the values in the Role Type column!
For fun, I pulled out some org-chart data from an old client that had over 1900 records. I was able to get that data into the template’s format fairly easily, but Refresh just churned for awhile, and never completed:
Early days, and perhaps not the target scenario for the tool!
More Data Visualizer!
If Data Visualizer is new to you, then you’ll surely be interested in more information. I’ve added a bunch of links below, and I’ve tried to order them from newest to oldest – so you can gauge how relevant the information is.
A special shout out to fellow MVP David Parker of bVisual.net (and author of Mastering Data Visualization with Microsoft Visio Professional 2016) for creating a large portion of the articles and videos linked below!
Office.com Support
has three data visualizer articles, with no date. I think they try to keep these up-to-date, so let’s start with these:
Create a diagram in Excel with the Visio Data Visualizer add-in
Create a Data Visualizer diagram (no date)
Data Visualizer frequently asked questions (no date)
March 12, 2020
February 28, 2020
Creating Visio Tabs and Apps for Teams with SharePoint Framework (SPFx)
The accompanying SharePoint + Visio Online video:
December 23, 2019
December 17, 2019
November 20, 2019
https://excel.tv/microsoft-excel-visio-data-visualizer-add-in-for-excel-a-quick-guide/
April 11, 2019
Microsoft Tech Community:
Data Visualizer add-in for Excel now available in public preview
May 18, 2017
May 18, 2017, Part 1 has a companion video:
May 18, 2017
May 18, 2017, Part 2 also has a video:


Leave a Reply