 The last time I flew the Amsterdam to Seattle route on Northwest Airlines, I noticed an interesting graphic while trying to figure out how to watch a movie with the in-flight entertainment system.
The graphic showed a clever way to squeeze more steps into a gauge-graphic without using more space.
Of course I couldn’t resist turning it into a Visio SmartShape. You can download it here and use it your presentations and documentation to show ratings, status, priority or other relative data values that will pop off the page when illustrated visually!
Six-inch Screen: Not a Lot of Space!
Since the screen jammed into the head-rest of the guy-in-front-of-me’s seat is so small, the UI designers of the Linux-based system (I know, I saw a penguin on the reboot screen after the system crashed…) needed to cram more steps into a small space.
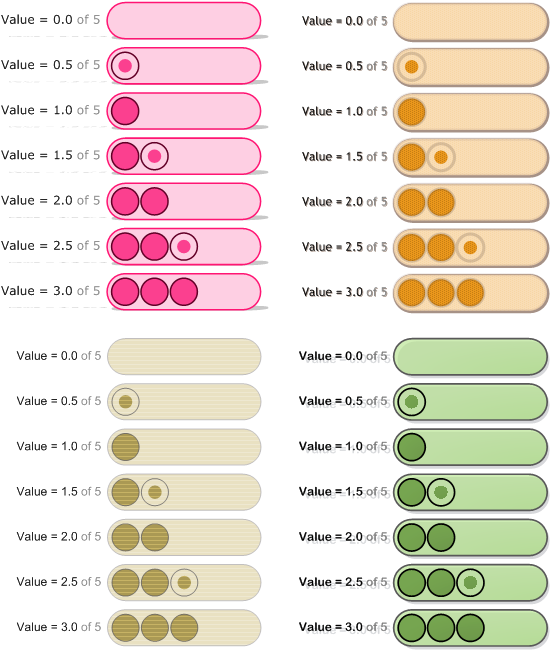
The control was used to adjust volume and brightness, and used “half-step dots” to increase the fineness or resolution of the control. It makes immediate sense if you just have a look:
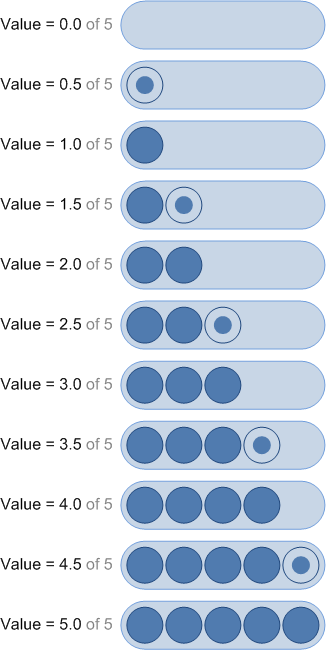
As you increased or decreased the level, the dots would sort of stutter at a position as they went from half-dot to full-dot, then on to the next location.
I just hope that the airlines won’t try and use this method to jam more people into the plane!
Your Very Own Gauge Shape!
Anyway, as I hinted before, I’m a visual geek and an info-graphic freak, so I couldn’t resist building a Visio SmartShape that mimicked this functionality! The image above shows the shape when it is configured to go from zero to five. But you can set it to have less increments:
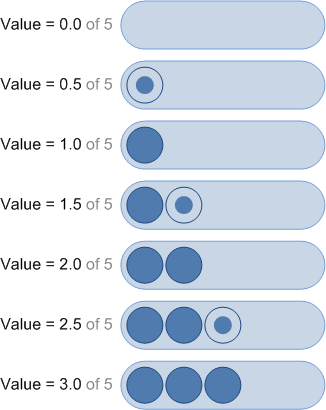 Setting the options of the shape are as easy as pie:
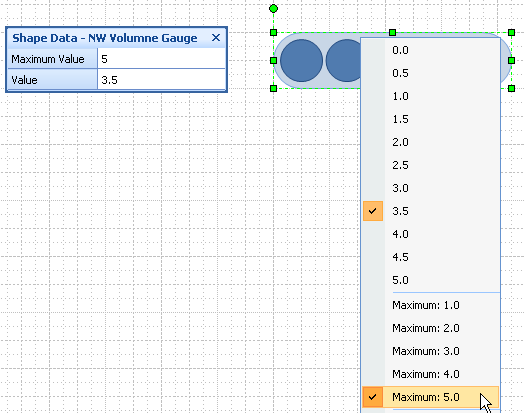
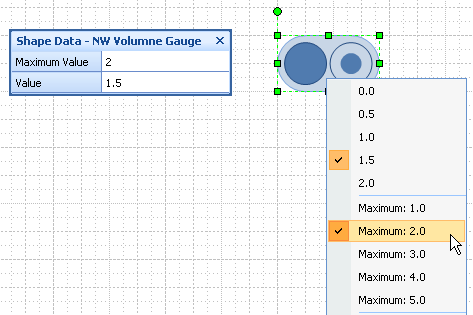
Yep, just right-click the shape to choose a value and a maximum value. If you’ve set your shape to have less possible values, the options shrink correspondingly:
 And if you like to burn up your color printer’s toner as fast as you can, you’ll be pleased with the shape’s behavior with Visio 2007’s Themes functionality.
With the click of a button or two, you can change the look and feel of your document–colors, fonts, shadow effects, backgrounds–and your gauge shape goes nicely along for the ride!
Data Graphic, Please?
The shape can be placed as-is into any Visio drawing, and quickly configured. But it also screams to be used as a data-graphic. Maybe some of you feel like taking on this challenge. If so, have a look at: Building Custom Data Graphics for Visio 2007 on MSDN.
You’ll also information about building data graphics on Visio Guy. Check out these articles:
- Trilogy-meter Data Graphics Part I
- Trilogy-meter Data Graphics Part II
- Trilogy-meter Data Graphics Part III
- Ape to Man Data Graphic
- Forefront Icons and Data Graphic Shapes
- Book Review: Visualizing Information with Microsoft Office Visio 2007
- Data Graphics Resources
- 12 Month Data Graphic Shape (almost)
And if you liked the style of today’s gauge shape, check out these articles that relate to similar SmartShapes:
- Run Circles Around Your Text With the Circle-text Title SmartShape
- Number Your Pages Visually
- Number Your Pages Visually…Some More
Download “Northwest Airlines Volume Gauge Shape (Visio 2007 format)”
s!Aj0wJuswNyXlhwNNGZQ6q7BDeOf1 – Downloaded 2058 times – 103.00 BOther suggested uses for the volume gauge:

Not had this experience is past – I get a message saying I need to be logged in to download this “NW Airlines” shape?
Is it me & my system?
Thanks
Jim
Hi Jim,
It’s not an error, I just need to make the re-direct page a bit prettier.
Certain content will require (painless, cost-free) membership in order to download.
There’s a log-in at the very bottom of most Visio Guy pages, where you can create an account.
Nice idea
you know…you could take this further
Resolution: Instead of concentric circles, could use pie
quadrants for 0.25 resolution or say 10 pie shapes
for 0.1 resolution (0.25 or 0.1 in cenctric circles
might be hard to interpret visually)
Magnitude: Could offset the circles so that you could get
maybe 7 circles in the space of 5. Might not
be user friendly…just a thought.
UI: probably dont need all the options on the right click
just define 2 custom properties and work the math in
shapesheet. Ie value/max = valpercent…
for given shape, if valpercent > shapevalpercent, then
turn on else turn off. This is a bit tedious but
does not need any VBA.
Could even use this kind of thing for graphical math
shape 1 + shape 2 = shape 3. aka like hierglyphic math.
Aka like the movie Contact
Thanks for the stencil. Very nice.
I have turned it into a Data graphic, and I have gotten it to work. However, I have two obstacles (perhaps you can assist with)
a) I am applying this data graphic to a shape that also is being colored by value via the data graphic. Principally, this ends up coloring the volume graphic also (which is not what I would prefer). I assume that your stencil’s ability to accept themes causes this to happen. If I want to protect it, I assume I need to put some Guard() statements in there, but I am not sure exactly where/which shapes.. Advice?
b) I like that your stencil provides > 5 values (including half-values), however, data graphics-by-icon don’t seem to allow you to have more than 5. Am I missing something? I had pondered the idea of making two ‘half’ graphics that were located in the same place on the shape, one for the full circles and one for the half circles.. but it seems like this is a mediocre work around (assuming I could figure out how to do it). Advice?
thanks again for your blog .. I have learned a ton from it.
Hi Jm,
David Parker has figured out how to squeeze six icons out of an icon set here: http://blog.bvisual.net/2012/04/11/how-to-have-six-icons-in-a-visio-data-graphic-icon-set/
But I think you could probably use this graphic as a Data Bar instead. You would just have to figure out how to convert the values into half-increments, or normalize values to between 0 and 10.