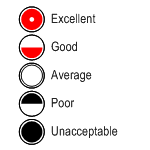
 Today’s post presents you with a Consumer Reports style ratings shape. The shape is what is traditionally referred to as a multi-shape. It has five states that allow you to graphically represent the quality of a particular characteristic. Consumer Reports names the states: Excellent, Good, Average, Poor, or Unacceptable. In our shape you can configure the names to your liking.
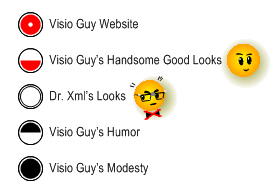
For instance, we might use the shape to rate some parts of this web site:Â

The shape can be changed using what I call “dual-mode” configuration. You can either right-click the shape and choose an item from the menu, or you can select an item from the drop-down list in the custom properties window.
I won’t write a treatise on how the shape is constructed, but I will give a few pointers for those brave enough to venture into the ShapeSheet.
Anatomy
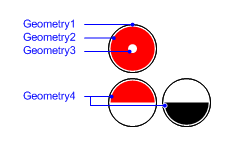
The shape was created from four different shapes, which were combined together.
The the shape was converted to be a group. This is done via Shape > Grouping > Convert to Group. Now a white-filled circle could be inserted inside the group, behind the smart details. This background shape doesn’t do anything interesting except, well, obscure the background!

Notice that the half-circle shape does double duty. A row in the Geometry4 section uses a smart formula to make the half-arc be on the top or on the bottom of the shape.
Dual Mode: Properties and Actions
If you look in the Custom Properties and Actions sections, you’ll see all sorts of formulas that link the two methods of configuring the shapes together.
You can change the actual names of the ratings by editing the Prop.Ratings cell itself. Just put semicolons (;) between your entries. When you change the names of the ratings, then the drop-down list items and the right-click menu items will change to match!
If you look in the User section, you’ll see this cell and formula:
User.index = LOOKUP(Prop.Rating,Prop.Rating.Format)
User.index converts the current Prop.Rating value of the shape to a numeric value. This makes it easier to write smart formulas for the various geometry sections.
The coloring of the shape also depends on User.index. Have a look in the Fill Format section. You’ll see:
FillForegnd = IF(User.index<2,2,IF(User.index=2,1,0))
This formula turns the shape red, white, or black, depending on the state of the shape.
Visibility
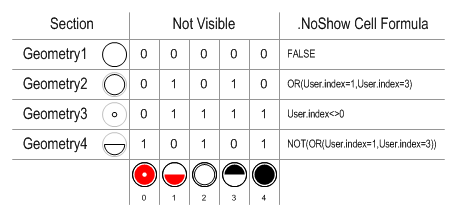
Pay attention to the GeometryN.NoShow cells. They rely on the value in User.index to turn the various geometry components on and off. The following chart shows how each Geometry section is NOT-visible. The logic is a reversed because the cell is called NoShow, so the matrix shows 1 where a section should not be seen.

Well, that’s just about it for today. You’ll find some other smart behaviors if you dig around but I’ll leave those for you to discover. I hope you have fun playing with this shape and dissecting it as well!
This shape is a prime candidate for use as a Data Graphic in the soon-to-be-released Visio 2007. Perhaps we will revisit this theme in a future article!
Download “Visio Consumer Reports Multi-Shape”
s!Aj0wJuswNyXlhS1QKNQIv_3KvGYd – Downloaded 3050 times – 103.00 BMore on Multi-shapes
- Fast Visio Flowcharts on Mai-lan’s Blog discusses the Flowchart Shapes shape in the flowcharting stencil.
- Wireframe Annotations in Visio on Boxes and Arrows blog talks about making an annotation multi-shape for wireframes.
- Creating a Multi-shape on Visio insights. Tips from folks who just may be smarter than the Visio Guy 🙂 This article teaches you how to make an LED digit shape. Very cool!

So will you be converting this to a Data Graphic?
Well I dunno, seems like a good idea. But only if there’s time after Spiral Maker, Part Deux 🙂
Hi Guys,
I am wondering how to find out the names/ids of the separat geometries within the ShapeSheet. (see the names in the second image in this article -> “Geometry 1″…)
Cheers
Chris
Hi Chris,
Are you talking about this Consumer Reports shape in particular, or general traversal of Visio shapes in general?