 The easy answer to this questions is: two. A single-shape can have two colors in its fill: a Fill Color and a Pattern Color.
If you want more, you have to group separate, differently-colored shapes together. In fact getting more colors is one of the major reasons that shapes become groups in the first place.
But if two were the actual answer, well, this article would over.
You see, Visio-Guy-friend Saveen Reddy has been up to his usual tricks of pushing Visio beyond the obvious and into the intriguing…
Saveen has come up with a creative technique that allows you to stuff four colors onto a single Visio shape! And he gets them to blend in eerily hypnotic ways that will make your Visio diagrams shine with sophistication.
This cool technique takes advantage of features that appeared in recent versions of Visio: transparency and more shadow-options.
The basic recipe to create a four-color shape, like that seen in the thumbnail at top is as follows:
- Apply a shadow to your shape
- Ensure that its size exactly matches the size of your shape
- Give the shadow zero offset, so that it is directly behind your shape
- Apply gradient-patterns to both the fill and shadow
- Apply transparency to both the fill and shadow so that you can see all four colors
If you want the detailed recipes, check out Saveen’s articles:
- Visio 2007 Trick: 3-Point Gradient Fills with Transparency
- Visio Trick: One-Color and Two-Color Glows
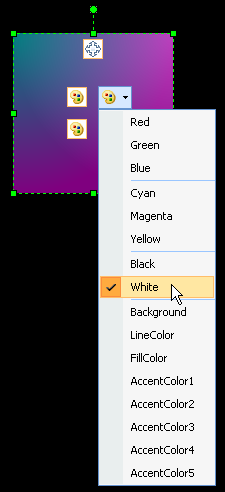
I’ve included some Visio SmartShapes for you to download that take advantage of this technique. The shapes are loaded with options that you access via Smart Tags. These are little drop-down icons that appear when you select the shape.
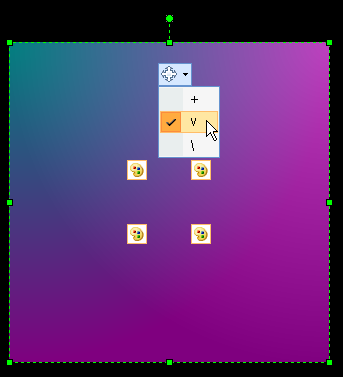
You can choose from three directions ofpatterns, which I’ve named “+“, “V” and “\“:

There are also 16 built-in colors for you to choose from. Since the shape has four colors, there are four little palette-icons that appear roughly where each color originates are on the shape. So for the “V” pattern, the icons appear near the corners of the shape, since the gradient-fills cross each other:

Note: you can assign various theme-based colors so that your shape will match the current Theme that is applied to your drawing. These are the colors with names such as “Background”, “AccentColor1”, “FillColor”, etc. If you use the 4-point Gradient Fill shape as a background, you can get subtle effects like this:

The following graphic breaks down each pattern option, and shows how the fill-pattenrn combines with the shadow-pattern:
Download “Four-point Gradient Fills in Visio”
s!Aj0wJuswNyXlhQMbeMB7ZcRK4U6r – Downloaded 4024 times – 103.00 B

I had a lot of hope for this blog, but I can’t believe how many post are along these line. Basically using visio where you would normally use illustrator.
I think most people want to see posts around parametric capabilities and using visio as a way of automating, not making more pretty. More pretty is nice, but to me and anyone I know it isn’t the most pressing thing. I’ve started to abandon visio in favor of graphviz frankly, much easier to actually integrate that with existing tools.
Hi Andrew,
I’ve observed that with operating systems, applications, the web, heck, even laptops, you’ll see that ‘pretty’ IS big business. Look at Vista and the Mac OS. Gummy-bears, glass, and glitter all over the place.
On the web, you’ve got rich interaction, animation, transparency, and other effects, brought to you by Flash or Ajax or Silverlight or WPF.
I see no reason why Visio needs to miss this party.
While this post may look like pretty graphics, the parametric mechanisms behind the SmartShapes are applicable to all areas of visualization: BPM, Networking, Floor- and Space-plans, database diagrams, UML, web-design, etc..
More and more sophisticated data-visualization is being done in Visio, and a lot of those visuals utilize color. So one can dissect the FREE shapes in this FREE article and learn how to parametrically control color in Visio.
And if one doesn’t care about the technical aspects, users can use the download to quickly add a nice looking background to their diagram, and configure it with a few clicks. How many steps would that take in Illustrator?
It’s all potentially serious stuff, in a light and fun format.
And, not everybody wants to shell out 600 bucks for an application with a steep learning curve, and an obvious (and clunky) Mac interface.
Adobe Illustrator is a great product that has its place, and that seems to be with Graphic Artists who get paid to create stunning graphics. Visio fills a lot of gaps between high-end tools and pen + paper.
Please send us your ideas of what you’d like to see on this blog, either via the contact form on the About page, or in the Suggestion Box comments.
Cheers,
– Chris
Andrew – pretty diagrams almost always help me get the budget dollars I am requesting.
I get insane amounts of money for projects with stick figures and dri-erase (no kidding). Clear communication is one thing, but I think a lot of this visual detail verges on power-point glut (i.e. animated slide transitions, etc) that don’t contribute to the message. Making it easy to _almost_ automatically visualize data for my audience helps with what matters in the long run…how effectively was that money spent, did this help us meet our goals…
I do however bow to your expertise, and don’t mean to knock it. But to me the real power is continuing to push the boundaries of data visualization and parametric shapes/drawings. If I had the expertise, or when I do, i guess I’ll start that blog. The new oreilly data visualization book shows the real limits of visio, and where it can go.
Yeah,
I knew one project manager that was worried about what he called “cartoon syndrome”. That his developers would get sucked in to over-drawing every symbol, instead of, well, making them…symbols. So now I know what you’re talking about.
Oh, and are you talking about the book called “Visualizing Data”, per chance?
Cheers,
– Chris
Yes, that book.
Here is an example of something i’d love to have: I work on multiple iterations of a network. I’d like to assign shapes and connectors to specific layers, or assign them custom properties so that a different drawing shows up in each tab of a document (i.e. each page). This way I can make a change on a earlier iteration and have it reflected in the later iteration. Is this possible?
I work primarily with enterprise class networks where the rack counts tend to be several hundred. My experience has led me to notice that on the average about 2% per month have changes, so keeping the data in the drawings tends to be pretty intense. This leads to a lot of other issues (where to store the data, how to publish the drawings, maintenance, etc.) v2007 added a lot to solve this in the professional version with the addition of datarecordsets and linking information between shaIpes and data. This gives you the ability to assign multiple shapes (on different pages) to the same record, and when it is refreshed all of the shapes (custom properties) are also updated.
I assign shapes to layers based upon network status.
I assign cables to different layers based on function (patch cables, infrastructure, power)
al
I got Visio right. Everything was working fine with the color fill, for lines, text, objects. I decided I wanted to use a pattern for a section of pipe I was drawing. Color fill no longer works! Actually it seems to fill with white no matter what color you have selected, on objects anyway. Please help, I need to be able to change colors! I have undone everything I might have done.
Pretty is definitely good. Executives are very easily turned off by diagrams trying to tell them something important that is just scary/dull to look at.
I’ll certainly be using this trick to produce heat maps for risks, etc. Any chance someone can work out how to do a circular one though, with, say, a red centre, going through graded concentric rings of orange and yellow to green at the outside?!
Visio has a radial fill pattern (#40), as well as quarter-circles starting from a corner.
But getting shades of colors in rings isn’t built in. You end up having to make lots of concentric circles and giving them slightly different colors (along the grade, so to speak)
In illustration programs, they call this a blend, and Visio doesn’t have this capability built it. With automation, you can start to do it, but it’s not easy.
A site that helps you with heatmap | Provides information for customers and all website visitors. A wonderful resource.