 So you’ve created beautiful graphics in Visio, and you know how to add phantasmal ShapeSheet smarts to your shapes, now its time for you to make it all disappear! I often get asked how to toggle the visibility of various elements of Visio drawings, and I usually offer up one of many solutions. But I don’t think that those many solutions have ever been cataloged in a single place. Until, of course, now…
The Traditional Way
Let’s start with the traditional method of hiding things — the method I personally use most often. This method uses cells that specifically control the visibility of various parts of the shape.
The ShapeSheet has a number of cells that turn components on and off, all of which are TRUE/FALSE cells:
- NoFill
- NoLine
- NoShow
- Miscellaneous.HideText
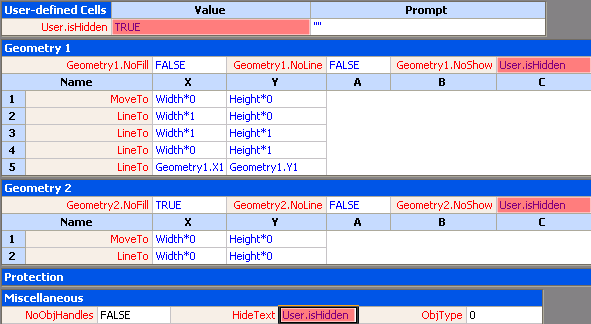
While NoFill and NoLine allow you to fine-tune the look of a geometry section, NoShow makes the whole component invisible. Of course, sometimes you may want to hide an entire shape, like when it is a sub-shape inside of a group. In this case, you have to set every single NoShow cell in each geometry section, because there is no cell that hides the entire shape.
If you need to hide the text of the shape, that is easily accomplished via the Miscellaneous section’s HideText cell. If you have lots of elements to show and hide, it’s good to centralize the control in a user-cell. Below, we can see a shape configured to hide all geometry and text, according to the value of User.isHidden.
Formatting
Of course, if you need to hide an entire shape, it seems like it makes sense to just use formatting. Your natural inclination might be to use the color cells to hide our shape:
- Fill.Format.FillForegnd
- Fill Format.FillBkgnd
- Fill Format.ShdwForegndTrans
- Fill Format.ShdwBackgndTrans
- Line Format.LineColor
- Character.Char.Color
However, there isn’t really a clear color, so we might choose white (color 1) to match the paper. This might work for most scenarios, but feels like a bit of a hack. You’d get into trouble if you had a shape hidden in this way laying on top of a visible shape, because the white would cover up the other shape.
In thinking about a clear color, we realize that it’s not the color that’s clear, but the pattern that’s none! So let’s consider the pattern cells:
- Fill Format.FillPattern = IF( User.isHidden, 0, 1 )
- FillFormat.ShdwPattern
- Fill Format.LinePattern
While 0 represents the no-pattern for line and fill, there’s no equivalent for text. So we’ll still need to use Miscellaneous.HideText to make our characters invisible.A shape that is 100% transparent certainly has a clear color, so this might be another strategy: make the shape completely see-through! These cells control transparency in a shape:
- Fill Format.FillForegndTrans = IF( User.isHidden, 100%, 0 )
- Fill Format.FillBkgrndTrans
- Fill Format.ShdwForegndTrans
- Fill Format.ShdwBackgndTrans
- Line Format.LineColorTrans
- Character.Char.ColorTrans
This is nice, in that it doesn’t change the color of the shape in any way. But it can affect just as many cells as The Traditional Way, unless you have a very large number of geometry sections. Plus, it requires that messy IF statement that is considerably more typing than = User.isHidden
Another danger with using formatting cells has to do with styles. Even if you protect your formulas with the GUARD() function, the application of styles will blow the formula away. If a user chooses individual formatting options, like color, or pattern from a toolbar or dialog, then GUARD() survives. But if the user applies a style, then GUARD() gets blasted.
Size
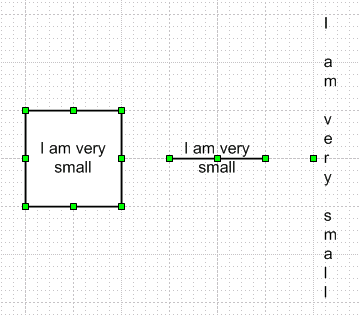
See-through was a nice idea, but how about: too small to see? We can hide entire shapes by simply making them 0 x 0! Yes, you can make them infinitesimally small!
The only caveat here is that the font-size won’t automatically shrink with the shape. If you don’t use the HideText cell, then you’ll end up with an ugly, very tall, single-character wide column of text floating above an invisible shape!
Note that this strategy will require formulas in the shape’s Width and Height cells. If you GUARD these cells to protect your formulas, then the user won’t be able to change the size of the shape. However, if you’re using Visio 2003, though, then this won’t be a problem. A new function, SETATREFEXPR, will let you have the best of both worlds
This is how you would set the width and height formulas:
- Shape Transform.Width = SETATREFEXPR( 3in ) * NOT( User.isHidden )
- Shape Transform.Height = SETATREFEXPR( 3in )*NOT(User.isHidden)
If User.isHidden is TRUE, or 1, then the expressions evaluate to zero, and the shape disappears. If FALSE, or 0, then the formula evaluates to the last size to which the shape was sized. This last-size-value is stored in the parentheses and is shown as 3in in this example. I know it looks a bit weird, but it works!
Crop
If you have a foreign object in a shape, such as a bitmap or a metafile, you can do an interesting technique that’s related to cropping. You can simply shift the image out of the viewing panel!
When you have a foreign object in Visio, the ShapeSheet will contain the section: Foreign Image Info. This controls the zoom of the image relative to its shape-container, and the degree to which it is panned. By default, an image exactly matches its containing shape, and we have four very boring formulas, as shown:
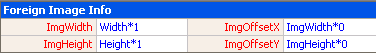
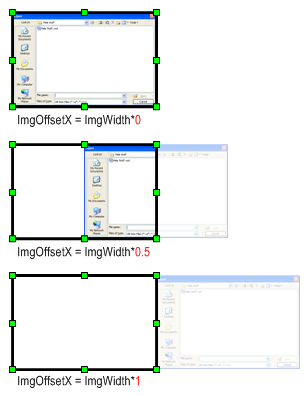
You can simply change either the X or Y offset cells to be “times one”, and that will completely shift the image out of view, giving you nothing to look at!
- Foreign Image Info.ImageOffsetX = ImgWidth * User.isHidden
- Foreign Image Info.ImgOffsetY = ImgHeight*0
Notice the black line on the shape. That’s actually geometry! By default a foreign image shape has one geometry section that forms a rectangle around the shape. You’ll want to delete that section or hide it as well.
Layers
You can turn off a whole class of shapes by simply assigning them to a layer, then turning off the visibility of that layer. You add a shape to a layer via the Format > Layer dialog, and you change layer properties via the View > Layer Properties dialog.
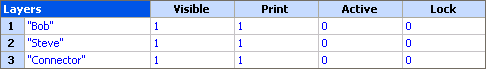
And you can even manipulate layer visibility via the ShapeSheet. Suppose we have three layers on a page: Bob, Steve and Connector. In the page’s ShapeSheet, the Layers section would look something like this:
We could add a right-mouse action to a shape, or to the page that would allow users to quickly
toggle the visibility of this layer. In our case, layer Steve is in the second row, so it’s (his?) visibility cell is called Layers.Visible[2]
Actions.ToggleSteve.Action =
SETF( GetRef( ThePage!Layers.Visible[2] ), NOT( ThePage!Layers.Visible[2] ) )
An action in the page’s ShapeSheet doesn’t need the ThePage! Prefix, so the formula would be simpler:
Actions.ToggleSteve.Action
= SETF( GetRef( Layers.Visible[2] ), NOT( Layers.Visible[2]) )
It’s worth pointing out that it might not be such a good idea to put this action on a shape that belongs to the “Steve” layer itself, because you won’t have anything to right-click on the first time you hide the layer!
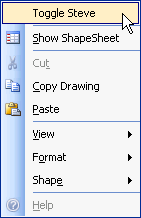
But right-mouse actions on the page are cool. You can quickly right-click the page, and toggle the “Steve” layer, and our life’s goals instantly become fulfilled!
Handles
You can also show and hide elements of the user interface, i.e.: handles and highlight-boxes. The miscellaneous section has five cells that deal with UI:
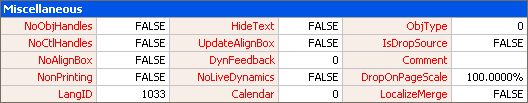
- Miscellaneous.NoObjHandles
- Miscellaneous.NoCtlHandles
- Miscellaneous.NoAlignBox
- Miscellaneous.DynFeedback
- Miscellaneous.NoLiveDynamics
Normally, when you resize a shape, you see what it looks like, as you are dragging. If your shape is especially complex, this can bog down, and be jerky and distracting. It’s a good idea to set NoLiveDynamics to TRUE for complex shapes. Then the user will just see a “rubber-band” outline of the shape’s width and height as a sizing handle is dragged.
DynFeedback seems to only apply the Dynamic Connector shape, and controls the complexity of the ghosting displayed by the connector as you drag an endpoint. This cell didn’t seem to really affect anything.
I believe it might be a leftover from older versions of the Dynamic Connector, and isn’t particularly interesting anymore.
You can have shapes that are visible, but don’t print by setting the cell:
- Miscellaneous.NonPrinting
Individual Control Handles
NoCtlHandles will turn off all of your control handles, but if you want to hide individual control handles, there is another technique: just add 5 to either the .XCon or .YCon cells. These cells are seen in the ShapeSheet under the column names: “X Behavior” and “Y Behavior”, but for some reason, the cells have these funny “Con” names. They specify how the control responds when the shape is resized (e.g.: “stay relative to the left/bottom” or “reposition proportionally”)
A common application of this technique is used for control handles that control the location of the text block. If the shape has no text, then we don’t want to have a control handle dangling in space. So we check for no-text, and turn off the control handle if this is true.
The system of formulas looks something like this:
- Text Transform.TxtPinX = Controls.Row_1
- Text Transform.TxtPinY = Controls.Row_1.Y
- Controls.Row_1 = 0 + 5 * StrSame( ShapeText (TheText ), “” )
So if StrSame() is TRUE, that means we have no text, and we also have 5 x 1, which will hide the control handle. You only have to do this in either the X or Y cell, not both. I put 0 + at the beginning to illustrate that the 5-part can be separate from whatever control handle behavior you choose.
Automation methods:
Of course, there are many objects that you can hide via automation as well. These are fully documented in the Developer Reference help that ships with Visio, or you can get even more information from the Visio SDK. I’ll at least point you in the right direction here by giving you a rundown of the properties that you can set, and the objects they affect.
Visible property:
- Application object
- InvisibleApp object
- Menu object
- MenuItem object
- MenuSet object
- Toolbar object
- ToolbarItem object
- Window object
Hidden property
- Master object
- Style object
You can also create an invisible instance of the Visio application with code such as this:
Visio.InvisibleApp visAppInvis = new Visio.InvisibleApp);
Well, that’s about it for now. Time for me to disappear!

Hi,
This is fab and I love the site – much appreciate.
Quick question: Once I’ve modified my ShapeSheet (both page and shape properties) is there an easy way to apply the changes to existing visio sheets/process maps?
Thanks;
I have employed the layer visibility method on a shape and it works splendidly, until I drag the shape into a stencil. When the shape is added to a stencil, the Action formula changes to =SETF(REF(),NOT(REF())). If I then edit the master shape within the stencil, I can correct the formula but it gets dropped when the shape is dragged into a new drawing. Any thoughts on how to overcome this?
Steven,
Layers are a bit tricky. They are page-specific and can be different for each page. Even if you have the same layers on two different pages, their order (i.e. their indices) can be different.
For this reason, it’s better to have a right-mouse action for the page that controls layer visibility. Putting it on a shape causes problems.
I think that when you create the master, then the master’s page initially doesn’t have the layer for a split second, or the layer’s index in the master is different than it was on the page. That’s what’s causing your REF errors.
– Chris
David,
If you modify a local master (go to File > Shapes > Show Document Stencil — every Visio document has an internal stencil) then all instances of that shape on every page in the document will be updated.
If you change a master in an external stencil (which is a separate file) then that won’t have an affect on your document.
You can use automation (like VBA) to make lots of changes rapidly, but you need to essentially create code that does exactly what you did via the ShapeSheet. Not always an easy task 🙁
– Chris
Visio Guy,
Being able to access your site has allowed me to enhance my Visio charts in a very positive manner.
There’s one item that I haven’t been able to create or find, it’s a multi-layed, color selectable, circular pyramid. Is this functionality available in Visio?
Dennis,
There’s two options:
1. In Visio, open this stencil: Charts & Graphs > Marketing Diagrams. There’s a few pyramid shapes there.
2. Check out my post: Marketing Pyramid Shapes. There are enhanced versions of what you get with Visio that you can download for free.
If I have two shapes A and B on a page and I set the User-Defined Cell of shape A to User.IsHidden. Is it possible for me to access this User-Defined Cell from shape B’s shapesheet?
Hi Phil,
You can do this with a “cross-sheet reference”. Look under Format > Special to find the ID of, say, Shape A. Then in the ShapeSheet of Shape B, enter User.IsHidden = Sheet.AID!User.IsHidden. AID will be a number, so you’ll have something like Sheet.141!User.IsHidden.
– Chris
Chris,
Thanks for your help. To take this one step further, is it possible to do the same thing using the .name or .nameu properties?
Many thanks,
Phil
Chris,
Thanks for your help. I found a link here:
http://msdn2.microsoft.com/en-us/library/aa223379(office.11).aspx
That explained everything.
Phil
how about sendtoback and bringtofront commands; is it possible to call them from shape’s cells? (like this: if User.isHidden then call SendToBack else call BringToFront)?
Hi Alex,
You can do this, but you need to find the numeric command to get this done. These can be found under the visUICmds enumeration in the SDK, or in the Object Browser in the VBA editor. To save you time, here are the interesting command ids: visCmdObjectSendToBack = 1048, visCmdObjectSendToBack = 1048, visCmdObjectSendToBack = 1048 and visCmdObjectSendToBack = 1048.
You wrap the command ids in the ShapeSheet’s DOCMD() function. For instance:
EventDrop = DOCMD(1048)
will send a shape to back on drop, which can be useful for connectors in certain diagrams. Hope this gets you started!
– Chris
I’m experienced with Excel and VBA but new to Visio. Multi-Shape behavior can be pretty perplexing. Briefly:
I have ship shapes saved to a Stencil as their pictures. I would like to cluster ships into battle groups that are represented by a Rounded Rectangle. In other words, combine 3 or 4 ships and hide them “under the skirt” of the Rectangle with their individual information still being available.
Is there any way to do that. As a test, I created 4 squares, performed a Shape -> Operations -> Join on them and then dropped the Rectangle on them and did a Shape -> Operations -> Intersect. I sort of got the outline that I wanted but cannot do anything with the resulting composite Shape. So I guess I have to back out of that. But I’m not sure where to turn.
Any Ideas?
Thanks Much,
SteveM
Hi Steve!
Try Shape > Operations > Combine.
Fragment, Join, Subtract are all somewhat destructive. Union kind of mushes everything together. Combine will keep all of your geometries separate, so you can go into the ShapeSheet and actually see each piece in a separate Geometry section.
Have a look at the “Flowchart shapes” master, located on the “Basic Flowchart Shapes” stencil. This is a great place to see how four different flowchart shapes are combined into one.
– Chris
Hi,
i have a spooky behavior here. I have set a group Object(Sheet.14) where i want part of this group only to be visible if a customer property value is set in the group object. So created a user defined cell “User.IsHidden” in the object that is part of the group and linked it with the formula”=DEPENDSON(Sheet.14!Prop.Row_6)+IF(Sheet.14!Prop.Row_6=””,FALSE,TRUE)”. Then linked cell Misc-HideText to the cell “User.IsHidden” to toggle the text off if no value is set. That works fine so far.
But then i linked Geometry1.-Geometry1.NoShow also to cell “User.IsHidden”, but that did not work. I tried also to use the same formula as in the cell “User.IsHidden”, but that does not work also. But i can toggle this value manually and this works fine.
I am wondering if there is any limit, but i your example you could link also all values to the same cell.
Any ideas?
best regards
Sascha
Tag Sascha,
Fangen wir mit deiner Formel an:
= DEPENDSON(Sheet.14!Prop.Row_6)+IF(Sheet.14!Prop.Row_6=””,FALSE,TRUE)
This has a few problems. First, you don’t need the DEPENDSON part. The IF-statement should be enough. That leaves us with:
= IF(Sheet.14!Prop.Row_6=””,FALSE,TRUE)
Which gives us a text comparison, which isn’t straight-forward in Visio. Visio developers are often tricked by the problem of text-comparison in the ShapeSheet, because you can’t just test strings with the equals (=) sign, unfortunately.
Instead, you can use the STRSAME function, however. So try this:
= IF(STRSAME(Sheet.14!Prop.Row_6,””),FALSE,TRUE)
You can shorten your formula to one of the following, as the results will be true or false:
= NOT(STRSAME(Sheet.14!Prop.Row_6,””))
= LEN(Sheet.14!Prop.Row_6)<>0
One of these solutions should fix your problem!
– Chris
Hi Chris,
= NOT(LEN(Sheet.14!Prop.Row_6)0) worked fine 😉
Thank you very much. I am working on the other stuff with the embedded excel and it works also now. Maybe i can send you a documented sample for your blog. I am also very happy about the map of Germany.
best regards
Sascha
Hi, I need hide or show a layer from a event click or doubleclick in a shape. If this avaible from the shapesheet Doubleclick event? Thamks and sorry for my english.
Rafa
You use the same formula in the article:
Actions.ToggleSteve.Action =
SETF( GetRef( ThePage!Layers.Visible[2] ), NOT( ThePage!Layers.Visible[2] ) )
Only you put the formula into the EventDblClick cell. This is in the Events section in the ShapeSheet. So, like this:
EventDblClick =
SETF( GetRef( ThePage!Layers.Visible[2] ), NOT( ThePage!Layers.Visible[2] ) )
The “[2]” is for the layer in row 2 of the Layers section in the Page’s ShapeSheet. Your layer might be different, and the layers won’t be the same on every page.
Hi. It seems that the HideText and Geometry.NoShow only works with a single shape. Is there a way I can show/hide an entire group without using VBA?
Hi Tien,
You’re right. Review the article again, just under “The Traditional Way”. You need to set all of the GeometryN.NoShow cells in all of the sub-shapes.
Or, you can shrink the shape (or sub-shapes) to 0 x 0, or put it (or sub-shapes) on a layer and hide the layers.
– Chris
I’m trying to toggle visibility of layers.
The solution described above – adding a right-mouse action to a page – seems ideal.
However, I’m quite a novice and need further guidance on how/where I add this action in order to create the right-mouse menu item.
Thanks!
Hi J,
1. Make sure nothing is selected on the page
2. Choose the menu: Window > Show ShapeSheet
You should see a Layers section, among others
3. Right-click anywhere in the ShapeSheet window
4. Choose Insert Section…
5. Check Actions and hit OK
That should get you closer. You can copy the formulas in the article above. Right-click to insert more Action rows as well.
– Chris
Hi Chris,
That works brilliantly – thanks for your help.
Pity it doesn’t work in Full Screen mode though!
Thanks,
J
Hi,
thanks for you usefull website and articles !!
I found very interesting information about “noshow” properties and geometry section.
I have a question on noshow properties. Some drawing doesn’t have a geometry section, why ??
Thanks again for your answer
Hervé
Hi Herve,
Some shapes are imported, like bitmaps or meta-files, and don’t need to have any Geometry sections.
By default, they *do* have rectangles–a default rectangle that doesn’t serve much purpose–but some shape designers delete them to make the shapes more efficient.
This is the case with pure text blocks too. A text block comes with a rectangle, but if it is only intended to be used for text, a shape designer might delete the Geometry section for that rectangle to save space.
I’m trying to toggle the layers on a page. I followed your steps in 25. I have the action items, but when I select the item nothing happens on the page. I’ve filled in the “Action” & “Menu” columns. Am I missing something. Thanks for your help. This site is great.
Alan
Hi Alan,
What did you put in the Action cells?
Something like:
SETF( GetRef( Layers.Visible[2] ), NOT( Layers.Visible[2] ) )
I hope…
Hi,
I have two layers that I want to toggle. I’m working in the Page ShapeSheet.
This is what I have in the action field:
“SETF( GetRef( Layers.Visible ), NOT( Layers.Visible ) )”
“SETF( GetRef( Layers.Visible[2] ), NOT( Layers.Visible[2] ) )”
If I remove the quotes above, I get error in formula when I press enter.
In the Menu fields I have:
“Toggle Base Layer”
“Toggle Tech Layer”
The TagName, ButtonFace, and SortKey fields are empty. The Checked and Disabled fields are 0. The Readonly, Invisible, and BeginGroup is set to FALSE.
I’m running Visio Professional 2003 SP3.
Thanks,
Alan
Alan,
That looks right to me. When you created the SETF formulas, did you get the “Layers.Visible” and “Layers.Visible[2]” by clicking in those layer cells (like you do in Excel) or did you just try typing them in?
It might be that the indices have somehow gotten weird, so it might help to get the cell-references by clicking rather than typing.
Also, if you start with a clean document and add two layers, then make these actions, does it work for you?
– Chris
Hi Chris,
I’ve tried typing “Layers.Visible” & clicking in the field and it still doesn’t work. I’ve also tried a new document and it still doesn’t work. Do I need to have VB or some other program installed? Thank you for all the time you’ve spent helping me. I’m not sure what else to do.
Alan
Hi Alan,
I sent you an e-mail that might have got junk-filtered. Check your spam directory 🙂
– Chris
Chris,
Is there a way to show two different colors in one Visio box?
We have 1 employee who we want to show as dual reporting by showing different color for each of the individuals he reports to.
Thank you in advance,
Iliana
Hi Iliana,
If you need to show more than one fill color for a shape, that is usually grounds for grouping. Ie: draw two rectangles, give them different colors, select both, then Shape > Grouping > Group them together (or Ctrl + G)
There are some tricks, though, for instance:
How Many Fill Colors Can You Put on a Visio Shape?
It sounds like you are using the Org Charting solution, though, so you would have to modify the Org Chart shapes. And Visio seems to not like it when we modify these shapes, and adds the originals back no matter what we do. Your situation might be more complicated than can be answered here…
Hi, I am trying to change the colour of a grouped object using a shape sheet in my VB.NET code.
I am trying to change the colour of line in my visio diagram by filtering using a custom property.
If it is a single line the colour of the line is getting changed, but if i have grouped two lines and tried to change the colour in shape sheet , it is getting changed on shape sheet values but not reflecting in the diagram. Can you please help?
Hi Visio Guy,
Great resource, thanks for posting.
I got the same problem that Alan above it seems, trying to use your formula only gave “formula error” no matter how I formatted it (I’m new to Visio actions…)
=SETF("Layers.Visible[2]",NOT(Layers.Visible[2]))worked for me, though. Not sure what the GetRef is for, and the use of quotes gives me the creeps. But it works.
(Visio 2003 standard)
Hi Petter,
Try this instead:
=SETF(GETREF(Layers.Visible[2]),NOT(Layers.Visible[2]))it’s better to use the GETREF wrapper instead of quotes.
hi, I need show/hide a shape, from other shape. For Example, I have a ShapeA, and i need click over the shape; and then hide/show a ShapeB, in the same page. Can you help me?
Thanks and great site. Sorry for my english
Rafa
Im designing a network map and i have two layers switch layer for devices and cable layer for cabling. I can make the shapes invisible by deselecting visible in layer properties but the data graphics attatched to the shapes stay visible is there anyway to make them both invisible ?
Hi Mark,
Yeah, the Data Graphics are assigned to the “Data Graphics” layer by default, as far as I can see. You’d have to re-assign the data graphic to have the same layer as it’s owning shape.
I don’t recall any options that do this automatically. If your drawing/solution involves any code, you could write a routine to do this for you automatically.
Kind of a pain, though…
– Chris
Hello,
Similar to a Kumar who posted a question on March 3 (don’t see any response to his query), I am having a similar problem changing the line color of a shape that is made of group of shapes. I have a custom property that I am using in my logic for LineColor in the shapesheet to determine what LineColor to set the shape to. When I change the custom property of shape and right-click to see what the Line Color has been set to, it is exactly as the logic directs but the shape itself shows no such visible change to correspond to the line color setting. Any help on this?
Thanks,
Les
Will the layers right click approach be functional within Visio Viewer?
Hi Sean,
I highly doubt it. I don’t think that any custom right-click actions (that you create yourself in the ShapeSheet)show up in the viewer.
Hi Chris
I would like to change the FillPattern according the the value of a Custom (or standard) Shape Property. I used an If statement in the FillPattern field in the Fill Format window, but the Shape does not change. When I display the Fill Window, the new value is there, but the Shape has not changed. Any ideas how to fix this?
Thanx
Corne
Hi Cornea,
It’s possible that your shape is a group and that the subshapes within the group are not referring to the group’s FillPattern cell.
When you use the UI to apply a fill pattern, Visio blasts all the subshapes within the group with the new pattern. But when you set the FillPattern ShapeSheet cell’s formula, the subshapes know nothing about this. You have to set up references to the group.
So say your shape has an ID of 5. The subshapes need to have the formula:
FillPattern = Sheet.5!FillPattern
FillPattern = GUARD(Sheet.5!FillPattern)
Use GUARD if you don’t want UI pattern-application to affect the subshapes.
Hi Chris,
I want to resize the width for a functional band (vertical swimlane flowchart). The shape is unlocked, the layer is unlocked, unfortunately seems this dimension has a minimum limit. Every time I’m trying to narrow this band, it snaps back to the limit width… Must change some user-defined cells in ShapeSheet windows ?…seems you need to be a scientist to change this sheet…
Is it a limit of Visio 2007 ?!!!.
Thanks,
TN
Hi Les (& Kumar),
When you change formatting using the user interface, Visio sets the LineColor, FillForegnd, Fillbkgnd, etc. ShapeSheet cells for every shape that is selected, and every subshape within those shapes.
When you set, say, the LineColor cell for a grouped shape, the subshapes do not get this change. You have to create a reference from every subshape up to the group, and you should probably lock those formulas using GUARD.
So, say your group is Sheet.13 (see: http://www.visguy.com/2009/07/15/whats-my-shapes-id/ for more on shape ids), then you would need formulas like this, for example:
Group’s LineColor = Prop.UserChosenColor
Subshape 1’s LineColor = GUARD(Sheet.13!LineColor)
Subshape 2’s LineColor = GUARD(Sheet.13!LineColor)
Subshape 3’s LineColor = GUARD(Sheet.13!LineColor)
etc.
Hi VisioCadet/TN,
I just fired up a Virtual PC with Visio 2007 on it. I had no problem changing the width of vertical swimlane bands using the shape handles or the ShapeSheet. Not sure where your problem lies…