Today, we continue with the movie-trilogy theme, but concentrate on advanced tips for importing and working with multiple shapes automatically.
This is the third and final piece in our trilogy of articles on Visio data graphics and data-linking.
If you haven’t read Part I and Part II of this three-part series on Visio data graphics and data linking, I urge you to check them out now. Without this background information, today’s article won’t make a lot of sense. You can find them here:
Trilogy-meter Data Graphics Part I
Trilogy-meter Data Graphics Part II
The Goal: Many Data-linked Shapes With Attached Info-graphics
What we want to do today is this:
- Import 21 images related to movie trilogies
- Link each image to a corresponding Excel ratings data record
- Display this data on each shape using a data graphic
- Use as many automatic features as possible
When we’re all done, we’ll have 21 trilogy shapes, each showing ratings for part 1, part 2 and part 3 of the series.
They will look something like this:
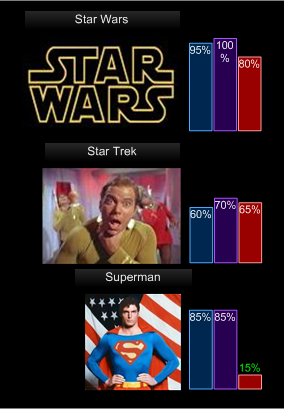
The first two articles in this series have already discussed the details of adding shape data fields to shapes, linking real data to shapes, and creating data graphics to show off the data. Today we’ll focus on handling large numbers of shapes and data records.
Get the Images
Before we get too far down the road, we’ll need some images to work with. I simply went to Google, searched on each of the 21 trilogies listed in the Excel spreadsheet, and saved a thumbnail that I liked to my hard drive.
If you’re extremely curious, you can see them here:
click image for larger view
If you’re extremely lazy efficient, you can get them all zipped-up here: Download: trilogy-images (76 KB)
And if you don’t have the Excel file from the first two articles of this series, you can get it here: Download: trilogy-meter-data.zip (5 KB)
Batch Importing
After manually downloading twenty-one thumbnails from the web (phew!), I wanted to import them into Visio.
The trouble is, Insert > Picture > From File only allows you to select one blasted picture at a time! Since I’m a (half) developer, I just don’t have the patience for this, when there are ways to automate such drudgery.
List File Names Using a Batch File
So the first thing I did was to automatically create a list of all the filenames for each image that was downloaded. I did this by creating a batch file called: dump names.bat. This file has only three lines in it, two of which you don’t need, but are there so that you can see what happened while the file is working.
dir *.jpg /b
dir *.jpg > movies.txt /b
pause
The first and last lines are just for show when you double-click on the .bat file. The middle line sends each .jpg file to a text file, without all of the path, and date and extra info:

After running this, you’ll have a shiny-new text file called movies.txt, with the contents of your image directory:
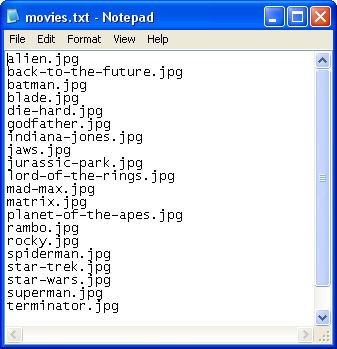
You can easily copy and paste this list, into, oh I don’t know, say a bit of VBA code that just might import all of the images into Visio for you!
Import Images Using VBA Code
And here’s that bit of VBA code. You can see where I’ve pasted the file names at the beginning, then wrapped line-continuations and quote marks around each item so that I could quickly process them in an array.
Option Explicit On

Sub ImportImages()

'// Imports a bunch of images as specified in
'// the arr variable, and adds the 'Trilogy'
'// shape data field to each image.
'// Note: this code must be in a Visio document's
'// VBA project, and the document must be saved
'// in the same directory as the image files.
'// List of files to import (from batch file):

Dim arr As Object
arr = Array( _
"alien.jpg", _
"back-to-the-future.jpg", _
"batman.jpg", _
"blade.jpg", _
"die-hard.jpg", _
"godfather.jpg", _
"indiana-jones.jpg", _
"jaws.jpg", _
"jurassic-park.jpg", _
"lord-of-the-rings.jpg", _
"mad-max.jpg", _
"matrix.jpg", _
"planet-of-the-apes.jpg", _
"rambo.jpg", _
"rocky.jpg", _
"spiderman.jpg", _
"star-trek.jpg", _
"star-wars.jpg", _
"superman.jpg", _
"terminator.jpg", _
"x-men.jpg")

'// Get a page object:
Dim pg As Visio.Page
pg = Visio.ActivePage

Dim shp As Visio.Shape
Dim iRow As Integer
Dim imageFileName As String
Dim niceName As String

'// ShapeSheet section and row constants for Shape
'// Data/Custom Propertes section. Makes code easier
'// to read:
Const SEC_PROP% = Visio.VisSectionIndices.visSectionProp
Const ROW_PROP_LABEL% = Visio.VisCellIndices.visCustPropsLabel
Const ROW_PROP_VALUE% = Visio.VisCellIndices.visCustPropsValue
Const ROW_LAST% = Visio.VisRowIndices.visRowLast
Const ROW_TAG_DEFAULT% = Visio.VisRowTags.visTagDefault

Dim i As Integer
For i = LBound(arr) To UBound(arr)

'// Get the file name from the array:
imageFileName = arr(i)

'// Build a user-friendly name from the file
'// name by getting rid of the file-extension,
'// replacing dashes with spaces and capitalizing
'// the first letter of each word.
'//
'// So, for example: "back-to-the-future.jpg"
'// becomes "Back To The Future". Not perfect,
'// but nicer than before:
niceName = Replace(imageFileName, "-", " ")
niceName = Replace(niceName, ".jpg", "")
niceName = VBA.StrConv(niceName, vbProperCase)[/code]
[code] '// Import an image:
shp = pg.Import(ThisDocument.Path & imageFileName)

'// Group the shape, because data graphics don't
'// work on images for some reason:
shp = shp.Group

'// Add just the 'Trilogy' Shape Data field:
iRow = shp.AddRow(SEC_PROP, ROW_LAST, ROW_TAG_DEFAULT)

'// Set the label for the shape data field:
shp.CellsSRC(SEC_PROP, iRow, ROW_PROP_LABEL).Formula = _
Chr(34) & "Trilogy" & Chr(34)<
 '// Set the value for the shape data field,
'// using the nice name:
shp.CellsSRC(SEC_PROP, iRow, ROW_PROP_VALUE).Formula = _
Chr(34) & niceName & Chr(34)
Next i
End Sub
If you use the batch file to create the list, then massage the list into the code above, you should be able to import a whole bunch of images lickity-split into Visio, and they will be ready to link to data and display data graphics, right away!
Or Import by Hand
If you don’t like reading code, that’s OK. What this code does can be summarized in a few bullet points:
- Defines the list of image file names as an array so that each item can be programmatically processed
- Imports each image into Visio as a shape
- Groups each shape (because data graphics don’t seem to work on images)
- Adds the shape data field “Trilogy” to the grouped shape
- Sets the Label for the shape data field to “Trilogy”
- Sets the Value for the shape data field to a prettied-up version of the file name.
If you don’t know much about using VBA code, and your head is spinning from the listing above, you might want to check out a few articles that will help to get you acquainted. First, have a look at John Goldsmith’s excellent “getting started” article: Just For Starters. Once you’re comfortable dabbling with VBA code and Visio, be sure to ease your peace of mind by educating yourself about VBA and security in: VBA Macro Security.
If you don’t want to mess with the VBA code at all, then this is what you’ll have to do to keep up:
- Import each image into Visio
You can do this using Insert > Picture > From File, or by clicking the Insert Picture button on the Picture Toolbar

- Select each image by itself, and group it by typing Ctrl+G or Shape > Grouping > Group
Visio’s data graphics don’t seem to work with images, so we make a group to fool Visio - Add the Shape Data field “Trilogy” to all 21 shapes
Just select all 21 shapes, then go to Data > Shape Data - Type the name of the trilogy into each Trilogy shape data field
These names should match those in the Excel file
Why Only One Shape Data Field?
You may have noticed that this time around, we’ve only added the “Trilogy” shape data field, but left the ratings fields out. We didn’t add Part 1, Part 2 and Part 3 like we did in the previous articles.
This is because Trilogy acts as a unique key into our database (the Excel file), and Visio has a way to help us link many shapes at once.
A Few Last Preparations
Before we’re ready to link, there’s just a few more things we need to do.
Go Get the Existing Data Graphic
We’ve now got 21 shapes just itching to be linked to data, but before we do that, we’ll want to go get the data graphic we built in Trilogy-meter Data Graphics Part II so we can apply it to our shape.
The easiest way to get a data graphic from one document into another is to simply drag a shape to which the data graphic is applied into the new document. Visio will bring along the data graphic for the ride.
Open the Excel File
If you’ve not done it already, we need to open the Excel file in Visio. You do this via Data > Link Data to Shapes, as discussed in the other articles.
When you’ve imported the data, you are ready to go. You should have an environment that looks something like this: 21 image shapes, grouped and populated with the Trilogy shape data field. Our custom multi-bar chart data graphic ready and waiting on the right, and our imported Excel data in the External Data pane at the bottom:
click for larger image
Time to Link!
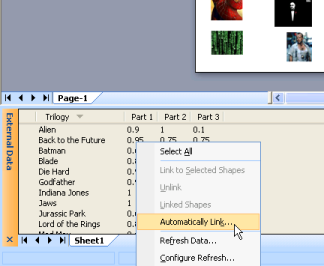
Finally we get to do the auto-linking. So go down to the External Data pane, right click and choose: Select All to highlight all of the records.
Select Data and Go!
Once all of the records are selected, you can right-click again and choose: Automatic Link…
Choose Auto-linking Options
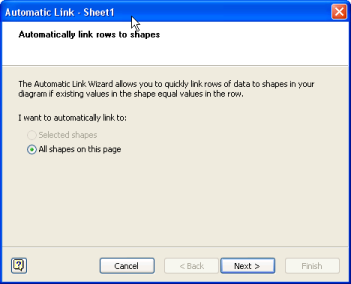
Visio will then present you with three dialogs to help in the auto-linking.
In our case, Visio guesses right each time. We want to link to all shapes on the current page:
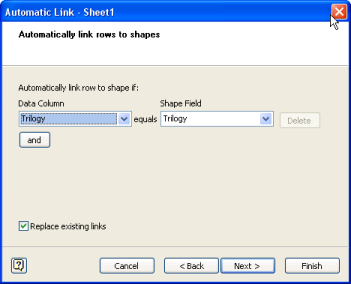
We want to link data records where the Trilogy data column is equal to the shape’s Trilogy shape data field:
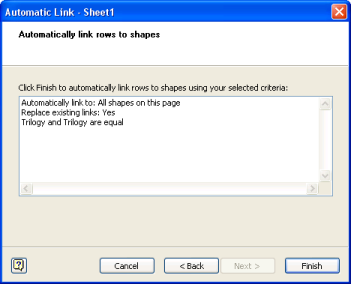
Visio summarizes the decisions that have been made, and leaves you to click the Finish button complete the auto-linking:
Tweak the Results
Voila! We can see here that the shapes have all been populated with data. We’ve selected the Star Wars shape, and can see in the Shape Data window that it indeed has three new data fields for Part 1, 2 and 3, along with the corresponding numerical data.
click for larger image
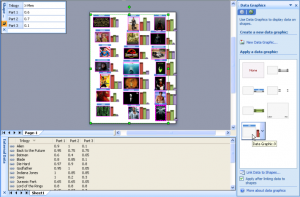
But there is a slight problem. Visio applied a data graphic to each shape, but it applied the wrong one. This is because the check-box at the bottom of the Data Graphics pane on the right is checked. The one that says: “Apply after linking data to shapes.”
One way to keep Visio from applying the wrong data graphic is to delete all of the other “default” data graphics from the Data Graphics pane. Another way is to simply uncheck that box.
Visio seems to try to use the last-applied data graphic as the default, but this would require you to first apply the data graphic to one shape in order to set a default. This seems kind of silly to me. I haven’t found any other way to specify which data graphic should be used in conjunction with our check-box, but if I do, I’ll be sure to let you know.
At any rate, it only takes a second to change the data graphic to our bar chart. Just select all of the image-shapes by drawing a selection net around them or pressing Ctrl+A, then click on our bar-chart data graphic. Presto, you’ve done it!
click for larger image




Thanks for all the tips!
Chris,
Two suggestions:
1) As long as you have to select all shapes and then apply the correct data graphic after doing the data linking — why not do it first and eliminate the application of the wrong one? To do so: a) Select All, b) apply the data graphic (nothing interesting will happen yet because the shapes don’t have data, but hang on for a moment), c) do the autolinking. The result: the data graphics will appear as soon as data linking is finished.
2) Even better, add two lines of code to your VBA routine to preselect the data graphic:
ActiveWindow.SelectAll
ActiveWindow.Selection.DataGraphic = _
ActiveDocument.Masters(“TrilogyDataGraphic”)
Then everything will be right when you do the autolinking. (NOTE: replace “TrilogyDataGraphic” with the actual name of your data graphic master.)
Of course, with another 6-8 lines of code you can even do the data linking automatically… maybe that should be the long anticipated fourth part of the trilogy!?!?
See Scott, the only way to get any comments is to write something stupid (hahahaha)
I had a feeling that there was a smarter way to do this, but I was packing for Seattle while writing these three articles…
But it seems to me that applying the data graphics before the auto linking will cause a problem, because the shapes don’t have all of the fields yet. The auto-linking actually adds the fields, so that they can then accept the data graphic properly. I’ll have to re-check this.
Thanks for the tips, and anybody who submits code automatically gets an extra FIVE POINTS!
Good point about the fields not being there yet, hadn’t thought about that… easy enough to add them in a “for each shp” loop…
Have a safe trip home (I arrived back in Boston a couple of hours ago).
Scott