 I’ve made a Visio diagram that will help you track the progress of the UEFA European Cup 2016.
Edit 2016.07.11
Congratulations Portugal!
Edit 2016.06.13
The latest scores from the weekend are up on OneDrive, plus several modifications suggested by fellow MVP David Parker have been added: you can now have a score of ?:? which results in no points, instead of 1-point ties. Plus, there are now hyperlinks to the teams and place of match when you right-click the match shapes. Cool!
If you’re not familiar with the tournament, this is soccer/football tournament that takes place every four years, in between World Cup years. It is the European equivalent of the Copa America, and other regional “mini world cups”. This year, 24 teams from all over Europe converge on France to compete for the title. You can find out more on UEFA’s Euro Cup 2016 website.
If you’re itching to get your hands on the download, you can get it now from this folder on my OneDrive. Pick the latest version, noting that the files end with a sortable date, such as “2016.06.10”.
Visio 2013 and Newer!
The file only works on Visio 2013 or newer. I attempted to save back to Visio 2010’s .VSD format, but too many of the features were lost in the process. Of course some of the fancy multi-stop gradient fills would be lost, but I was surprised that the filmstrip shapes used for the team graphics didn’t work, since I’ve created similar shapes in ancient versions of Visio. Something must be amiss with the save-back process.
Purpose of this Drawing
There are a bunch of reasons I created this drawing, some of them apply to you, some of them were for my own purposes. Here’s the list:
- Allow users to fill out their predictions for the tournament, for use in office pools and other competitions.
- Allow users to track the progress of the tournament, and use the file as a tournament calendar, since all match dates and times are shown.
- Allow users to learn about Shape Data fields, right-click options, list container shapes, and SmartShapes in general.
- Offer shapes that users could copy use for other purposes.
- Offer shapes that budding shape developers could dissect and examine to learn more about how to construct SmartShapes, create ShapeSheet formulas, and employ Shape Data.
- Allow me to mess around with some visual design, and create something (hopefully) good-looking.
- Allow me the opportunity to do some coding for finding shapes, building relationships, and examing the contents of list containers. The hope is to build some sort of general Tournament Building System some day, where raw inputs can be, say, stored in Excel, then imported into Visio. Then, at the press of a magic button, all visuals and relationships for the tournament can be built.
Two Pages: Group Stage and Knockout Stage
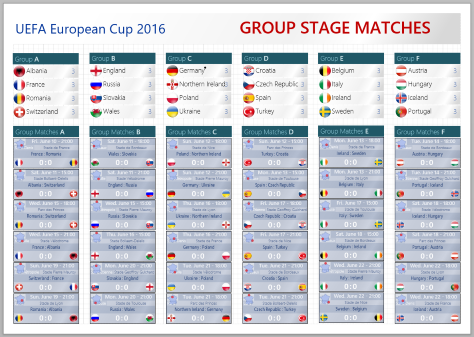
The file has two pages inside, one for each round of the tournament. You can see the page tabs near the bottom of the drawing window:

In the Group Stage, teams in each of the six groups compete. There are list container shapes that arrange all of the teams into groups, and hold shapes that represent each match. All of the teams, match dates, times, and venues are set up. Only the scores remain to be determined. You can type scores into the match shapes on this page, either as they happen, or to predict how you think things will happen.
This page has relationships set up, such that the team shapes in the lists on top display their point totals when the scores are entered. Right now, they all show “3”, since each match is currently a 0:0 tie.
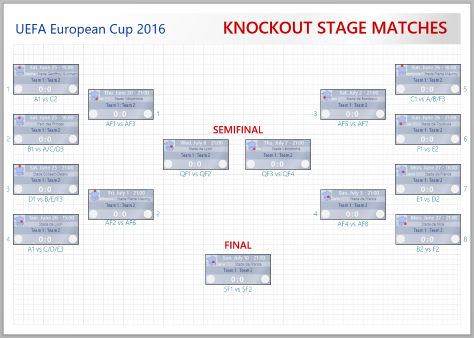
In the Knockout Stage, the best 16 of the 24 teams compete in a single-elimination tournament. The rules for who plays whom are a bit complicated, so I wasn’t able to set this up so that it calculated automatically. When we get to this stage, I’ll update the file and put it up on OneDrive. You can also manually set the teams by using the Shape Data panel.
Team Shapes
There are 24 team shapes arranged into 6 list shapes at the top of the Group page. The team shapes are a Visio SmartShapes that have some special behaviors.
You can pick the team that the shape represents by using the Team field in the Shape Data panel or right-clicking the shape. Here you can pick from the 24 participant shapes.
When you pick a team, the graphic will change to match the team’s country flag, and the text will display the selected team’s name. This was done by downloading all of the team images from the UEFA website, piecing them together into a single image, then employing the filmstrip technique to make the shape display one “frame” from the entire strip.
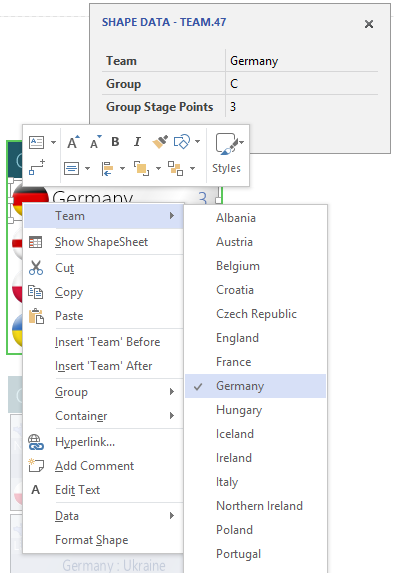
The Shape Data field for Group is automatically calculated when the team is selected. This is done via internal shape logic. The list of teams and the list of groups is stored inside the shape’s ShapeSheet, and Excel-like functions are used to calculate the group from the team. If you’re interested in learning more, read about the INDEX and LOOKUP ShapeSheet functions.
Match Shapes
Below the team shapes are other list shapes that group the six intra-group matches together. Each match shape already has the data set for the match date and time, the city and stadium, and the two teams that are competing.
This was done via the various fields in the Shape Data window. Note that the fields Team 1 Points and Team 2 Points are calculated from the results of the score. 3 points for victory, 1 point for a tie, and 0 points for a loss.
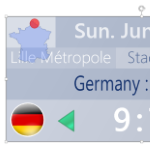
Notice how the data in the Shape Data panel is represented in the shape. Much of the information is shown as text, but the team flags are shown according to the teams selected. Also, a little map of France shows a red dot that corresponds to the city where the match takes place. This is all done with ShapeSheet logic! Building these shapes is rather fun, akin to playing with Lego.
It would take many pages to explain how these shapes are built, but you can download the document and try and dissect them yourselves.
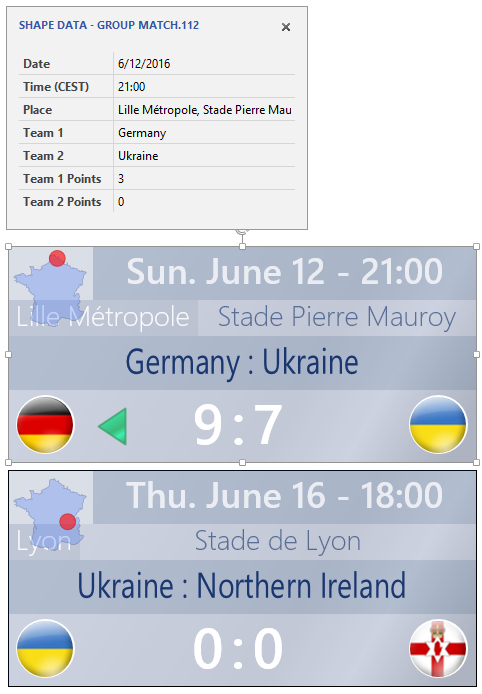
You can (must?) enter the scores for each match manually. (Or you can wait until I do it, and download the updated file.) I can imagine that you folks will use this shape to set your predictions for an office pool, or just to follow along.
To enter the score, simply select a match shape, then type score-colon-score. The text must contain a number, a colon, and a number. Spaces are OK, but unnecessary.
You can also double-click to enter “text edit mode”, then simply edit the score-text that is already there.

Notice two things that happen when you enter a score. First, if there’s a winner, then a green arrow points to it. Second, the points garnered by each team are reflected in the team shapes in the list containers at the top!
This was all setup using ShapeSheet formulas. Since there were a lot of formulas to create, I used VBA (Visual Basic) macro code to analyze the drawing, find the shapes, fields, and cells that applied to each team, then created Excel-like formulas in the team shapes to add up all of the points. Another complicated subject, but it is important to know that things like this can be done in Visio, and they can’t easily be done without code.
The list containers keep the member shapes tightly packed in an orderly column. But there’s no easy way to get the team shapes to sort by point totals. So, for example, say Ukraine ends up winning all of its matches, and gets 9 points. It will still be at the bottom of the list. You can easily change this by click-dragging Ukraine up to the top. Or just select it, and press the Up Arrow key three times. List containers are really cool shapes, that have a lot of utility, but are still a bit of a kept-secret within the Visio world.
Edit 2016.06.13
As mentioned above, fellow MVP David Parker sent over a few suggestions that I immediately implemented.
- You can enter a score of ?:?, which evaluates to 0 points. The previous default was 0:0, which gave every team 1 point, even though they might not have played any matches!
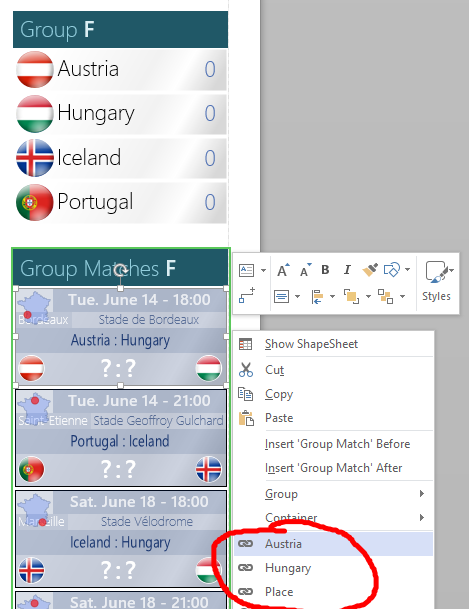
- If you right-click a match shape, you now get three hyperlinks: 1 for each team, plus one that links to the UEFA city guide for the place of the match.
Knockout Stage
I’ve made tournament diagrams before, and have usually been able to set up logic such that once the scores for a preliminary stage were set, then the knockout stage matches could be set. The diagrams were interactive and smart. You just entered scores, and the next stages were automatically populated with team data.
For Euro 2016, the logic of how to get from the group stage results to the knockout stage match teams wasn’t clear enough to me. Or it wasn’t clear to me how to make ShapeSheet logic that was practical enough to automate the entire document with a reasonable effort for a free download (smile, grin, wink).
So the Knockout page has all of the match shapes present, with their dates, times, and venues set. The participants, however, are not set. You can set those yourselves using the Shape Data fields Team 1 and Team 2.
I’ve placed text shapes next to each match that hints at which teams will play. Some are straightforward, others are not. For example “A1 vs C2” means that the winner of group A plays the second-place team from group C. “A/C/D3” means the third-place team from group A or C or D, but I’m not entirely clear on how this is determined, and I simply couldn’t afford the effort to find out how to do it.
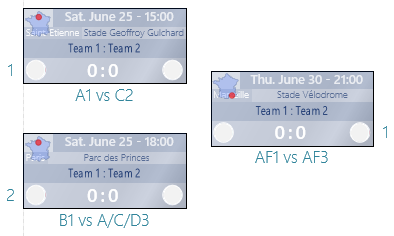
At any rate, it’s not too difficult to set the participants using Shape Data fields, and when you do, the team names and flags will show up on each match shape.
List Shapes
I’ve hinted about what I call “List container” shapes, and that they are a bit hidden in the Visio universe. In Visio 2010, “Containers” were introduced as a new way to group shapes together, without “grouping” them in the traditional sense. “Member” or “item” shapes can be dragged onto a container, and immediately become a member of the container. They can also be dragged off of the container just as easily.
When a container is moved, member shapes move along with the container. When a container is deleted, members are also deleted. When a container is duplicated, members are also duplicated. All without the cumbersome step of grouping (and ungrouping). And you don’t need to subselect shapes that are inside of containers (another cumbersome reality of groups.)
Lists are hybrid containers that do everything Containers do, but also keep member shapes tightly-packed, and in-order. You can drag (or arrow-key) list members up/down or forward/back in the list, and all the members stay neat-and-tidy, and in-order.
In this video, Organize Shapes with Containers and Lists, you can learn more about containers and lists from fellow Microsoft Visio MVPs David J. Parker and Scott Helmers:
You can add containers directly to a drawing via the Insert > Diagram Parts > Container drop-down list. List shapes, are a bit trickier to come by. Then tend to involve a system of shapes: the List and the Items.
You can find a few pre-built list shapes and list item shapes them in the product. Start by opening the Categories > Software and Database > Wireframe Diagram template. This will open multiple stencils, docked on the left. Some contain list-related shapes:
Toolbars stencil shapes
- Menu bar
- Menu bar item
- Drop-down menu
- Menu item
- Menu item separator
Controls stencil shapes
- List box
- List box item
- Tree control
- Tree control item
Notice the naming convention: item shapes that go into lists contain the word “item” in them. The lists themselves are configured to drop a few instances of the item shapes automatically, so you don’t have to do everything manually.
If you’re curious as to how to create container and list shapes from scratch, check out this article on MSDN: Custom Containers, Lists and Callouts in Visio 2010.
Download
As the tournament is long over, you can download the final version from my OneDrive here:
Download “UEFA Euro Cup 2016 Diagram (final)”
s!Aj0wJuswNyXlgxsRJlenWj-LL58K – Downloaded 2755 times – 103.00 B
Leave a Reply