 For years I’ve been toying with the idea of creating a set of shapes for well bore diagrams. Well bore schematic drawings show the important, ahem, bits, of an oil drilling system from up on the surface to way down in the Earth’s crust.
My most recent research on the subject came to an exciting conclusion: there’s nothing for me to do here, because somebody’s already done it!
If terms like Three-zone Completion, Pay Zone, Casing, Packer, Liner, Kickout, Depth Tag, Unloader, Emergency Control Valve, FCV Nipple, Tubing, Tubing Pup Joint, Perforations, Sliding Sleeve, or Blast Shield get you excited, then you’ll be happy to know that a Canadian company called C-mach Technologies Inc. makes a nice, Visio-based product called powerDRAW.net. (I love their cheeky tagline: “powerDRAW, Well drawn”) PowerDRAW.net combines a great set of very well-drawn shapes, with a helpful add-in that automates mundane and repetitive drawing tasks to further streamline your work.
If those words mean nothing to you, then take a quick look at this image-search result for “well bore diagrams”. That might give you a clue as to what this article is about:
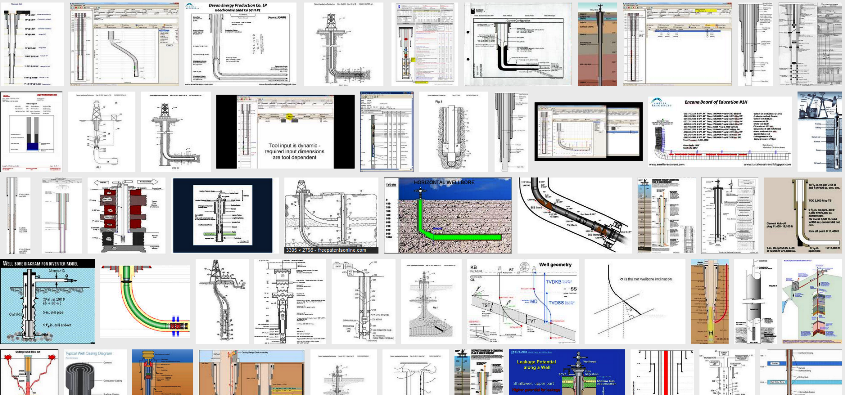
click to view larger image
Now I’ve long been fascinated by these drawings, and thought that Visio would be a good tool for creating them. I should add that I was quite surprised to discover many complicated solutions for well bore diagramming that were built on Excel–complete with graphics in one of the columns! Anyway, I was quite happy to find someone who had even more Visio-enthusiasm than I, and a heck of a lot more industry knowledge to go along with it!
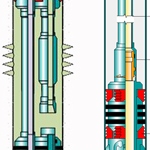
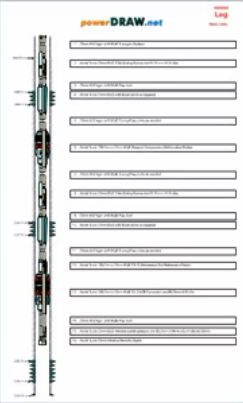
PowerDRAW has a showcase on their website, with several sample drawings. I’ve taken the liberty of sharing one of them here:
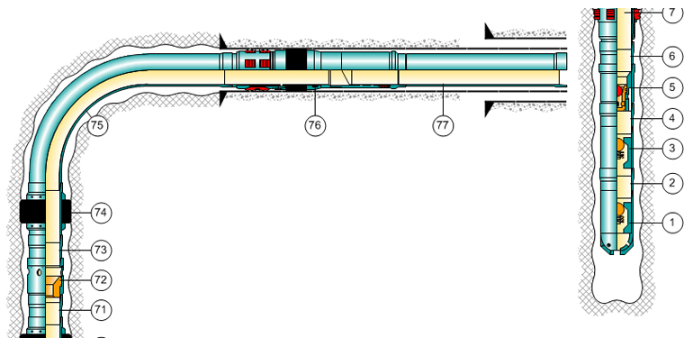
Pretty cool, eh?
Anyway, I wanted to find out more about powerDRAW.net, so I registered with their site so that I could get access to their 20-minute demo video.
To give you an idea of what kind of equipment is in the product, I was able to make out the names of 15 stencils that were open with the demo template. Here’s an intriguing snapshot of the Shapes window:
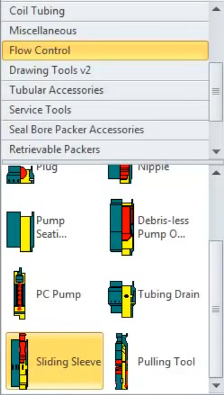
For those of you in the industry, the full list of stencil names is telling:
- Tubular Accessories
- Flow Control
- Seal Bore Packer Accessories
- Retrievable Packers
- Bridge Plugs
- Accessories – Casing
- Coil Tubing
- Packer Accessories
- TCP Equipment
- Drawing Tools v2
- Horizontal Multi Stage
- Tubular Anchors
- Miscellaneous
- Setting Tools
- Service Tools
The master shapes in these stencils are well-drawn, and have many SmartShape features, including control handles for graphically adjusting parts of the shapes and Shape Data fields that specify information useful for reporting, or for changing the look of the shape.
Many, if not all of the shapes have multiple views, such as small, large, open, closed, set, unset, etc. So, while the stencil set contains maybe several-hundred shapes, the permutations run into the thousands.
This parametrization is one of the main advantages of using well-designed Visio SmartShapes. Users need only search for a general class of shape, then they can fine tune the look of it using Shape Data fields, or control and alignment box handles.
In the video, Tubing with a Break shape was one of the first onto the page:
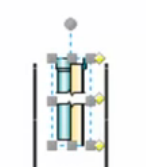
It had these Shape Data fields:
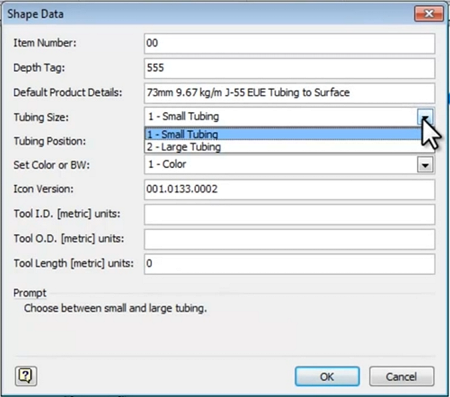
The drop-down lists seem to generally affect the appearance of the shape. The other fields are used in reporting or in the floating details view, in which the normally-hidden field information is displayed in callout-rectangles adjacent to the shapes.
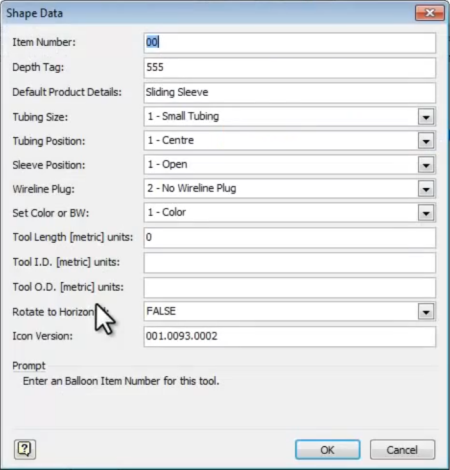
Here’s a Sliding Sleeve shape:
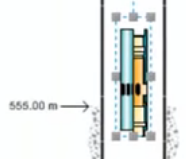
It has even more Shape Data fields than the tubing. Look at all those drop-down lists! To quote the narrator; “this shape has a lot of views built-in!”
The product contains not only Visio shapes and templates, but also an add-in that puts around 30 custom functions onto the ribbon. These help a lot with selection, alignment, labeling, numbering, tagging, exporting and other tasks that are hard to do by hand. At the end of just-under 20 minutes (with lots of talking), the narrator had completed the proposal shown (fuzzily) below.
You can see that quite a few shapes have been placed and configured via Shape Data and control handles. The add-in’s functions were used to add the floating-detail rectangles, align and space the shapes, and export to several formats. Not bad for a third of an hour’s work!
I’ve pointed out just a few of the niceties of the product in this article. If you’ve read this far, you’re either really curious, or pretty eager to learn more because you need this for your work. If so, you should probably read the full list of capabilities, on powerDRAW’s features page, where they’ll describe things with the correct terminology, as opposed to the scribblings of a hack like me who just watched the video.
Honestly, I’m surprised I didn’t stumble upon powerDRAW.net earlier, and I hope that writing this article brings it a bit more attention.
And seriously, who doesn’t get excited by Blast Shields!

WellView does this already which most companies already use in the O&G industry. Yes, its not in Visio, but its an instant visual representation of the wellbore.
Nice article. I am searching for VISIO usage on O&G industry and this one is a great contribution. Now I am focused on Upstream process. If anyone has other information about Microsoft Visio usage on O&G, application development, tools, add-ins, clip art library, etc … please, share withus: Adriano@ProjetosDigitais.com.br (from Brazil, Macae region)
It is an ok app. I used it when it first came out. It was a bit clunky so I don’t what it looks like now. It was a good concept and it doesn’t cost 10-20k a license that WellView does and subsequent 20% M&S of the list price a year either.