 If you aren’t interested in using Visio 2010 for creating sophisticated network rack diagrams, then you probably should be.
Today, fellow Visio-fan Al Edlund tells you why he loves to do this, shares insights on the matter, demos solutions he built, and offers a complete VS 2010 project, written in VB.NET, to help you get started!
The code shows you how to get network data from Excel, how to use the new List and Container shapes in Visio 2010, and how to manipulate them programmatically. All this to make your network diagrams even more powerful and easy to use!
This guest post was developed and written by Al Edlund. Al is a fellow Microsoft Visio Most Valuable Professional (MVP), and is a networking expert, and a big fan of Visio. He’s also told me that networking is also his hobby, so when he’s working he’s playing, and when he’s playing he’s working! Thanks Al for another great effort!
Introduction
This Visual Studio 2010 project demonstrates a number of concepts that can be used in developing applications in support of Visio network diagrams. In this project we will make further use of the data model that we have been using in previous projects.
For a brief introduction of the data model watch this video: MS Visio DC Rack Data and Visualization Strategy.
An overview of this project can be found over here: DC Rack Attribute Drill-down.
This project was constructed using:
- MS Visual Studio 2010 Professional (Released)
- MS Office Visio 2010 Professional (RTM x86)
- Microsoft Enterprise Library 5.0 released (get it here)
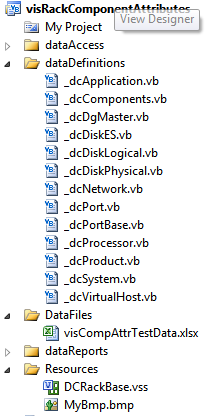
The project has two external files included. The two external files are a custom Visio stencil and an Excel workbook with sample data for the creation of the drawing. The sample data is saved in separate worksheets.
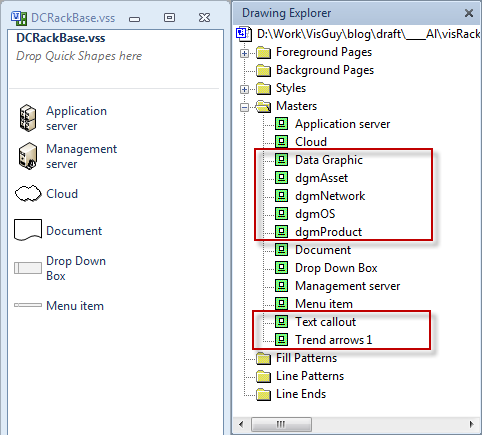
The Visio stencil file is called “DCRackBase.vss” and if you open it up, you will only see six masters. But it is important to note that this stencil also contains seven data graphic items that can only be seen in the Document Explorer. Data graphics are stored as a special type of master, not visible to the user in the stencil window. They do, of course show up in the Data Graphics list on the Data tab.
Importing Data
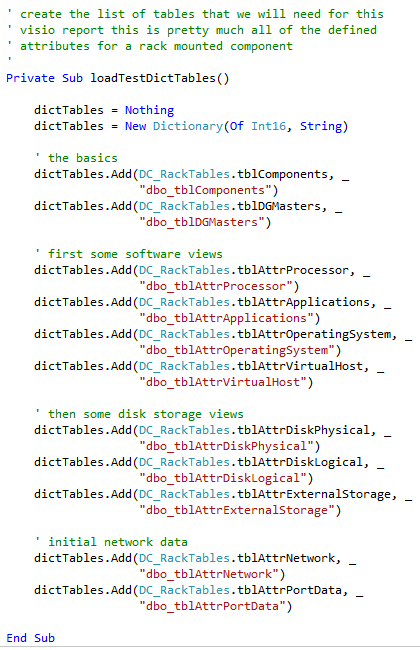
Each of the worksheets will be imported as System.Data.Datatable structures which have had matching DataDefinition and DataAccess classes created.
The default data source for all of these classes is a working SQL Server 2008 R2 database, so there are a lot of additional materials that will not be used in this example. We will focus entirely on the Excel Source. The mechanics of reading the Excel data as well as saving the drawings is in a marked section of the forms code file called #Region ” External get/save ”
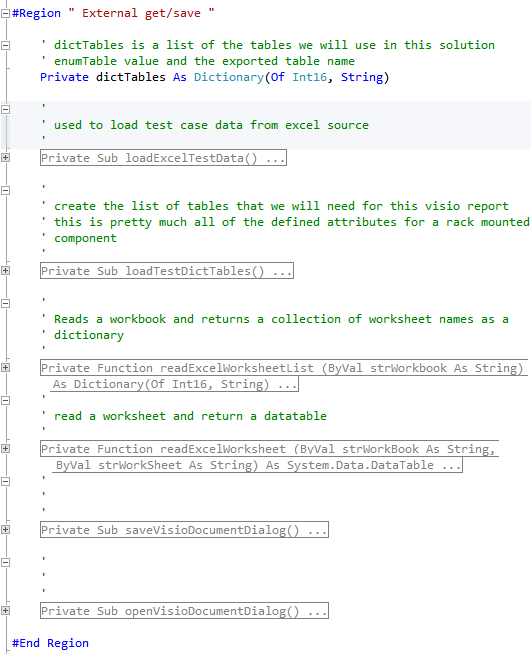
When the data is imported we save it in a data cache class that is shared among the different attribute sets:
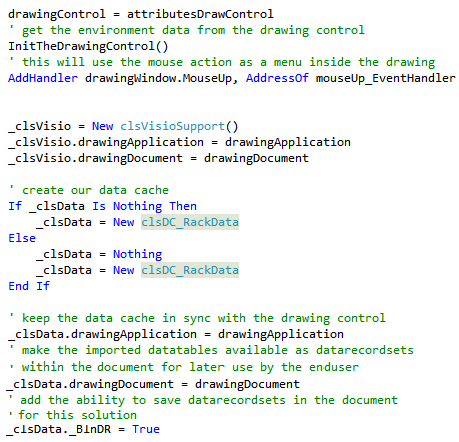
My personal preference is to not use the Visio DataRecordsets but the data cache class can save the converted data tables into the working document. In this example we have flagged the class (_blnDR) to save the attribute data into the document. When the document is saved the user will be prompted whether to keep it or discard the DataRecordsets.
One of the tables which the form imports is the tblDGMasters table. This table is one of two used in the full application that links Visio shapes and stencils to the creation of a working document (the other one is the tblProductData which is not included). When we load these tables we have the option of ‘preloading’ the defined Visio masters and stencils into the application. This is done so that the needed masters will be placed into the drawing’s document stencil ahead of time. This will improve drawing performance later on, because masters won’t need to be copied from an external stencil into the document.
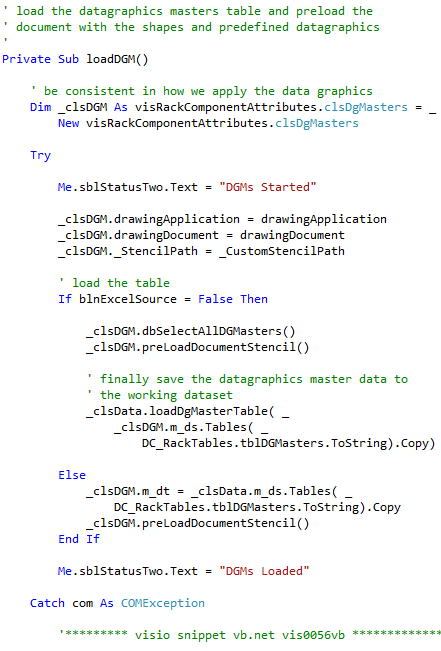
The tblDGMasters table allows the developer to identify surrogate shapes and data graphic masters for each of attribute tables external to the application. There are some VBA example code snippets in the Visio Guy discussion forum here: Using surrogate shapes for Data Graphics. Within this project we take advantage of it when we place the network attribute data on the page.
Mapping the tables to containers/lists
Each of the attribute tables will have its own Visio container shape on the page. This gives the flexibility to apply different header styles to each of the tables. Within each of the containers will be inserted a list control that can be formatted to support horizontal or vertical orientations as well as different sub-shapes such as list items or custom shapes. For each of the tables, constants have been created and placed at the top of the module:
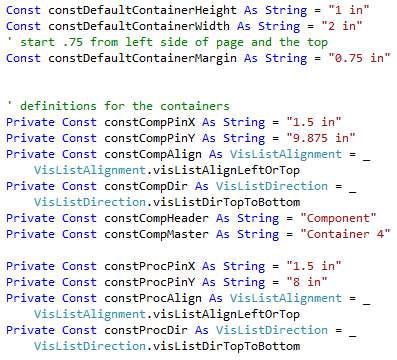
The methods used for containers and lists:
click to view larger image
click to view larger image The general flow for displaying the tables goes like this: First, we drop the container for the attribute set on the page. We pass it the master name, header, and shape name.

Then we get a collection of record keys from the imported data table that can be used as shape names for list items that we will create. This is needed so that all of the shape names on the page are unique.
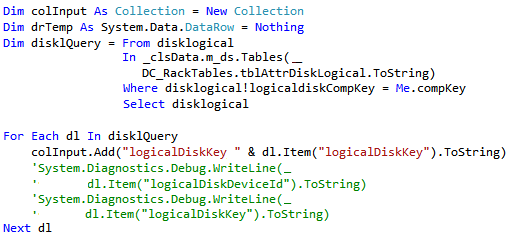
Next, pass the created collection of names to the routine that will drop ListBox items on the page. This is very similar to the DropMany method and returns a collection of shape IDs.

We then apply to each of the dropped shapes a set of shape data properties that were predefined in the data access classes.
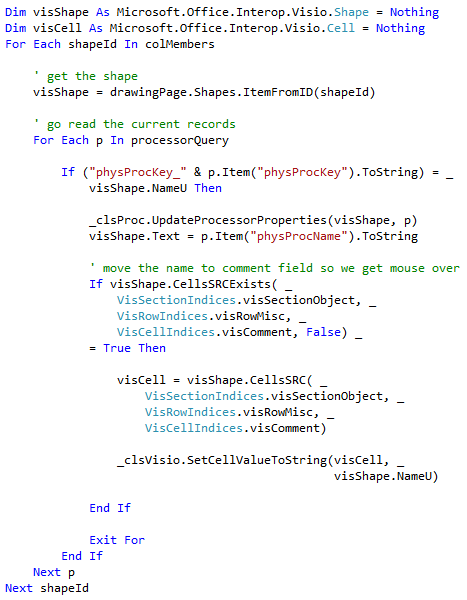
Lastly, we create the drop-down list with the collection of updated Visio Shapes. We add the list control to the container. Then we move the container to some position on the page:
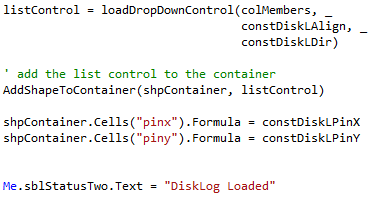
The thing to note about the adding shape to container is to move the shape in the vicinity of the container on the page so that when the shape is included the container size is somewhat rational.
Download “visRackComponentAttributes Visual Studio 2010 VB.NET Project”
s!Aj0wJuswNyXlhy22sWFgKH3wWU9J – Downloaded 3339 times – 103.00 B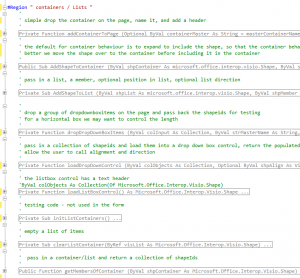

Hi – This is a great concept. When I downloaded the project however there is no frmVisioRack?