 Visio 2010 has added many, many new features for process diagramming and improvement. Partners are jumping at the chance to build sophisticated new add-ins and products on top of the Visio 2010 platform.
Today, Microsoft MVP Scott Helmers introduces you to Global360’s new analystView product and explains how it will help you to easily improve your business’ processes.
This guest post was written by Scott A. Helmers. Scott is a fellow Microsoft Visio Most Valuable Professional (MVP), and a Partner with the Harvard Computing Group, a consulting firm that specializes in process and change management. I’ve heard he also performs in musicals and plays trombone.
Background
Microsoft has added more enhancements and new features to Visio 2010 than to any release since they purchased the Visio product line in 2000. In addition, the community of developers building solutions on the Visio platform has continued to grow.
One of the best and most tightly integrated add-ins for Visio 2010 that I’ve seen is analystView from Global 360 (global360.com). analystView allows you to run full-scale simulations of BPMN processes – right inside Visio!

In addition, after simulating a process, you can have analystView optimize your process for you by juggling resource assignments and other process variables. Of course, if you prefer a more hands-on approach, you can manage the optimization yourself.
But that’s the end of the story… let’s start at the beginning.
Simulation for the Rest of Us
As a business process consultant, I face a dilemma shared by business analysts and process improvement consultants everywhere: how can I make more effective – and more quantifiable – process improvement recommendations?
One valuable tool is process simulation, but simulation systems have historically been very complex and have had steep learning curves. However, analystView changes the game – now you can simulate processes using Visio, the same software you already use to create your process models.
With analystView you can identify staffing problems, inefficient resource allocation, workflow bottlenecks and other process issues. You can also test your ideas for potential process changes. For example, you might experiment by changing staffing levels, by cross-training existing staff with new skills, or by designing alternate work paths through the process.
Simulation allows you to perform “what if” testing without disrupting your organization. It also provides quantifiable results so you can compare one scenario with another in order to identify the best process improvement recommendations for your organization.
At the Harvard Computing Group, it’s always been a challenge to recommend process simulation because flowcharts are seldom drawn with sufficient rigor to base simulations on them, and our clients typically don’t have access to dedicated simulation software.
Visio 2010 and analystView come to the rescue in just three steps.
Step 1: Use BPMN as a Common Mapping Language
Visio Premium 2010 incorporates a number of process-related features. For example, the Premium package provides both predefined and user-definable rules for validating business diagrams. It also offers a new template for creating process maps based on version 1.2 of the Business Process Modeling Notation (BPMN) standard.
With the BPMN template, business analysts can use an industry-standard language for mapping and integrating their process models. Teams of analysts can work on different pieces of a process model and then join their maps together. In addition, Visio BPMN models can be stored in SharePoint 2010’s new process repository, making collaboration on process improvement initiatives even easier.
I think the rigor provided by BPMN diagrams plus the collaboration facilities provided by SharePoint 2010, place Visio into serious contention with other process analysis tools.
If you aren’t familiar with BPMN, you’ll find a link to additional BPMN resources at the end of this article.
Step 2: Bring Your Process to Life
While your BPMN map shows how activities in your process are interrelated and illustrates the flow of work through the process, a static picture limits your ability to understand what really happens in the business. For organizations that want to move beyond static Visio maps, analystView can bring those maps to life.
Giving Life to Your Process
The lifeblood of your simulation is the data that describes your process. You’ll need information like:
- Start time and duration of the business process targeted for the simulation
- Data fields to be used or tracked during the simulation
- Roles, participants (both people and systems) and work schedules
- Frequency of arrival and size of work packages
- Key events, sub-processes and service level agreements (SLAs) you would like to track during execution of your simulation
Be aware that the list above is very general – you’ll actually need to spend time collecting and estimating a lot of data about your process in order to run an effective simulation. There is good news on two fronts, however.
First, Global 360, drawing on their years of experience in simulating, managing and improving processes, provides a wealth of online assistance. In addition to the sample “as is” and “to be” BPMN models that ship with analystView, Global 360 has loaded their web site with searchable help text, a Getting Started Guide, a User Guide and other resources to help you collect and organize the necessary information.
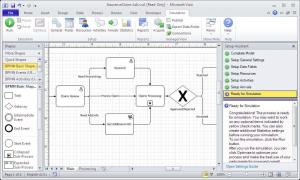
Second, analystView guides you through entering the required data, either using the buttons on the Simulation tab or working with the categories in the Setup Assistant pane (both are shown in Figure 1).
Figure 1: analystView Simulation tab and Setup Assistant pane (click to view larger image)
Checking the Pulse
There’s very little point in simulating a process if the underlying map contains errors. I like the fact that analystView double checks the health of your map by using both Visio’s built-in diagram validation rules and its own simulation validation rules.
Visio’s rules validate the connectivity of the drawing and analystView’s rules check the simulation data you’ve entered. If your diagram fails either set of validations, an Issues window appears that explains the problems.
Tracking the Vital Signs
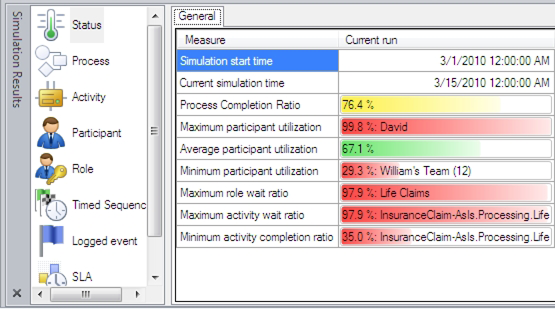
Watching analystView bring a BPMN model to life is exciting! As the simulation engine puts your model through its paces, it displays key vital signs in a set of color bars that highlight good, marginal and poor results in multiple categories. For example, Figure 2 shows the summary statistics after one simulation run of the “as is” insurance claims process that ships with analystView. (You should get identical results if you open the “as is” insurance example and click the Run button on the Simulation tab.)
Several issues jump out from the chart in Figure 2:
- David is overworked, with a utilization rate of nearly 100%.
- The overall completion rate for activities in this process bears attention, as it is only 76%.
- The primary bottleneck in this process appears related to handling of Life Claims; simulation results show very long wait times and very low completion ratios.

Figure 2: Simulation statistics for insurance claims “as is” process
Clicking the icons in the left pane in the Simulation Results window allows you to dig deeper into each activity, participant and role, as well as to evaluate results for SLAs, timed sequences and logged events.
I like analystView’s simple presentation of vital signs and its quantitative results. They highlight the good and bad aspects of a process, allowing me to quickly adjust, fine tune and optimize a process.
Step 3: Deliver the Best Process Improvement Recommendation
One of the features I like best about analystView is its ability to help you optimize your process. analystView’s Express Optimization automatically selects the activity with the longest wait time and adds participants to that activity based on the software’s predictions about participant utilization. After rerunning the simulation with optimized values, analystView offers a very effective side-by-side comparison of the “current” and “previous” data.
As you can see in Figure 3, Express Optimization has clearly improved the “as is” insurance process because wait times for the Current run are down and completion ratios are up.
Figure 3: Comparison of Current with Previous simulation statistics (click to view larger image)
It is beyond the scope of this article to explore analystView’s very sophisticated facilities for Custom Optimization, but I can assure you that the software will let you adjust workloads, routing, cross-training, role assignments and many other parameters in your quest to improve your process.
Summary
analystView from Global 360 is an exceptionally well-designed Visio add-in that offers sophisticated process simulation capabilities to Visio users. The Premium edition of Visio 2010 is a major step forward in making a great product even better, especially for business analysts, enterprise and system architects, and process implementers.
If you are in one of those categories, analystView and Visio 2010 will equip you with new ways to answer difficult questions about potential process improvements. You will be able to obtain data to test your assumptions about questions such as: Will this process change help or might it reduce process efficiency? What will happen if I add two more people here? What effect will it have if I cross-train this group so they can help in another part of the process?
It is no longer necessary for you to create a flowchart in Visio and then wonder whether you might be able to improve the process. With Visio Premium 2010 and analystView, you can test, change, and test again, until your simulated process achieves your organization’s goals.
More Information
- BPMN: www.bpmn.org
- analystView: www.global360.com/analystview
- Visio 2010: www.microsoft.com/office/2010/visio
- SharePoint 2010: www.microsoft.com/sharepoint
Scott Helmers is a Partner with the Harvard Computing Group, a consulting firm that specializes in process and change management. He is one of 14 people in the world to be named by Microsoft as a Visio Most Valuable Professional (MVP) and is the top Visio expert at IT help site Experts-Exchange.com. Scott has taught technology seminars for both Boston University and Northeastern University, as well as for clients on four continents. Scott is available at shelmers – at – harvardcomputing.com.
Full disclosure: Although Harvard Computing Group has no financial interest in analystView, they provided technical and marketing consulting services to Global 360 for the launch of analystView.


Leave a Reply