 If you’re trying to take Visio to the next level by writing code for custom solutions, then you’ve likely run into some aspect of connections.
The well-commented VBA code (provided by guest-poster Al Edlund) which accompanies this article will help you make programmatic sense of the elemental stuff of connected Visio diagrams: connectors, connection points, OneD shapes, Connect and FromConnect.
You’ll also see how to produce connected diagrams, find out which shape is connected to which, and more importantly, do some path analysis to find the deeper meaning behind it all!
This guest post was developed and written by Al Edlund. Al is a fellow Microsoft Visio Most Valuable Professional (MVP), and is a networking expert, and a big fan of Visio. He’s also told me that networking is also his hobby, so when he’s working he’s playing, and when he’s playing he’s working!
Thanks Al for a great effort, now take it away!
Connectors, Connections and Paths
I have seen a couple of recent requests that have focused on how to understand what is connected in a Visio drawing. What is sometimes missed is that there is a difference between connected and a path, which is a series of connections. This path deconstruction is sometimes referred to as graph analysis and is the study of how nodes (vertexes) attach to each other via “edges”.
What is sometimes overlooked by the user who wants to analyze the drawing via automation is that there are two levels of domain specific knowledge that are needed. The first is what is being represented by the shapes on the page and the second is how the underlying add-in portrayed that information.
This led me to a put together a two-part project which you can read about in these pages, and download when you’re done with the words. The project focuses on these two items:
- Demonstrates some concepts in analyzing a drawing’s connections
- Analyzes the path information
Using the Path Analysis Application
Once you’ve OK’d the VBA macros in the Visio file and clicked the StartTest button on page one, you’ll be presented with the project’s main form:
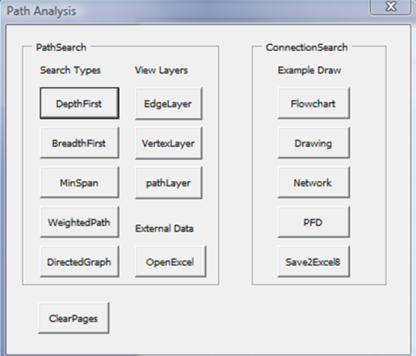
Figure 1 Example Menu layout
The path analysis form has two groups. The left one is for demonstrating path analysis and the right one is for drawing (connection) analysis.
The path analysis has three sections: the analysis algorithm, the view layers, and the open Excel button. The analysis algorithms create topology pages to demonstrate search techniques. The edge information and path search information are drawn on different layers which can be turned on/off by the layer buttons. The Open Excel feature is included to allow the user to pull in external data. The description of the workbook/worksheets is included in the code module: modDrawData.
The ConnectionsSearch section has four buttons. Flowchart draws the modified Visio 2007 SDK navigation example. The Drawing button uses the included page connection search to capture the active page connections. The Network button discovers the data from the network page, and the PFD button discovers the data from the pipes/flow/diagram. Lastly, the Save2Excel8 button takes the data from the last analysis and exports it to an Excel2003 format.
Flowchart
The Visio SDK has an example of analyzing a drawing (DemoNavigatingDrawing) which combines both of these concepts (connection analysis and path analysis).
I’ve included a modified version of this flowchart analysis in the drawing.
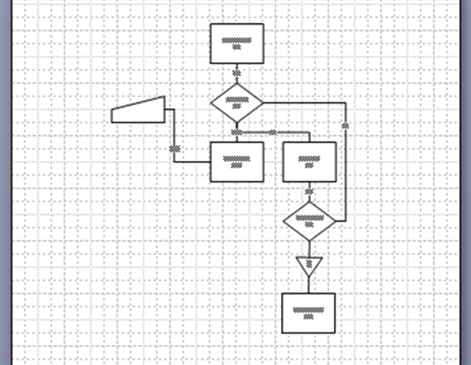
Figure 2 Flowchart Example used
The modifications include:
- Adding an additional data entry function
- Including a control transfer shape.
I added these to demonstrate that:
- In a drawing that is aware of the ‘directionality’ of dynamic connectors the developer may have to adopt a strategy that verifies that all shapes have been included
- Shape.Type = OneD shapes which are not ‘Dynamic connectors’ may be in the information path.
Network
I’ve included a network detail drawing as well which brings out a couple of other exposures. In this case the points that require attention include (once again) that OneD shapes may not necessarily be part of an information flow and (to make it a little more interesting) we have to track connector end-points based on their component and connection point.
Finally in the network connections the paths are assumed to be capable of ‘full duplex’ communications which removes the directionality aspect.
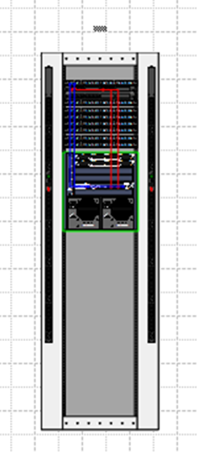
Figure 3 Network Detail Drawing used
Piping Flow (PFD)
The example of a piping flow drawing (provided by another user) as starting points has three sets of objects we want to track. These are equipment (vertices), piping (edges), and instrumentation (probes). The interesting point here is that a probe attaches to a OneD shape (pipes) in the example drawing.
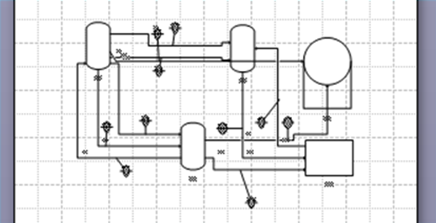
Figure 4 Piping-Flow diagram used
Both the network detail and PFD drawings also demonstrate that you have to be aware of the underlying add-in that created the drawing. In the case of the PFD drawing shape text is stored in a user field.
Save2Excel8
The captured data from the connection analysis can be saved to an Excel spreadsheet. Excel in this code is 2007 Excel and doesn’t do a lot of checking or error catching. It is there for convenience.
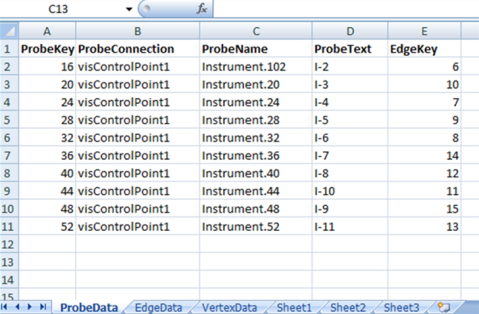
Figure 5 Excel Output (PFD drawing)
Path Analysis (Depth-first)
The second part of the project was to demonstrate some of the common methods for analyzing path information. The basic flows are excerpts from Data Structures and Algorithms Using Visual Basic.NET, a Michael McMillan book that was written for VB.NET.
I thought it would be fun to convert the concepts to VBA and then use Visio to draw the constructs and use layering to show how the algorithms worked. The data is based on two mandatory arrays (vertex and edge) and an optional array that allowed me to force some of the shapes to specific places on the page. A tutorial on this material goes well beyond what an article can cover. Mr. McMillan’s book is also referenced in the code.
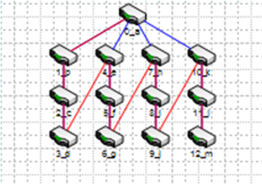
Figure 6 Path Analysis (depth first)
VBA Code
This code should not be considered as anything beyond demo code of some advanced concepts. When you open Visio’s VBA integrated development environment, you’ll see the following forms, modulas and classes:
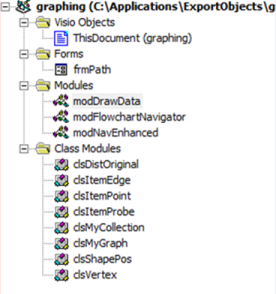
Figure 7 Application objects
Here’s a quick description of what each code file is about:
- frmPath user interface
- modDrawData the information used to initialize the three main arrays used to create the drawings used in the path analysis section
- modFlowchartNavigator the basic code used in the v2007 sdk that demonstrates an approach to moving through a visio flowchart
- modNavEnhanced an example of how analyzing a drawing might be enhanced using the two examples provided (Network Detail and PFD)
- clsDistOriginal object storage
- clsItemEdge object storage
- clsItemPoint object storage
- clsItempProbe object storage
- clsVertex object storage
- clsShapePos object storage
- clsMyCollection string / array manipulation
- clsMyGraph path analysis code
Have fun,
al
Download “Path Analysis in Visio VBA Code Sample and Diagram”
s!Aj0wJuswNyXlhXwn1leC9Gi3LjZY – Downloaded 8278 times – 103.00 B
I have tried to understand connections, but after two days I forget. That’s why I’ll wait for Visio Next Version.
The same thing for a language as Python. It may be very powerful, but what is the use if you forget it after one week ?
Hi Philippe,
I guess the best thing to do is develop some libraries that make connecting a matter of one call to one method.
Visio 2007 has the new AutoConnect method, which makes coding somewhat easier than before.
But I’ll agree with you. The raw Visio connection API is too elemental and I too forget some details that I always have to look up again!
Um, I have a dumb question. How do I actually open the code to view all the code pieces? I was able to open one piece of code, but it looked far too short for the functionality displayed. How do I view all those modules and classes?
Thanks!
tools=>macros=>visual basic editor
should look like the screen capture above, there’s also code in the form ….
al
Hi!
I am currently developing an application in VISIO.
Please, I want to walk the path between two objects and save the path in a list, that contains the objects traversed
so, from an object I want to achieve another object and save the path (objects) in a list
thank you for helping me
best regards
Simo
Hi Simo,
Have you downloaded the zip file and looked at the code? In Visio 2010, it is much easier because of the new ConnectedShapes and GluedShapes API methods.
In older versions of Visio, you can look at the FromConnects collection on a shape, get the connectors that are connected to it, then look at the Connects collection of each connector to see which shape is on the other end. It’s kind of a pain in the butt, but it isn’t rocket science!
The Visio SDK contains developer reference help on using the methods, as well as sample code.
Hello Al and Visio Guy,
I enjoyed your article http://www.visguy.com/2009/04/08/path-analysis-in-visio/.
Is there a way to use the VB macros to analyse an existing Visio GUI drawing? To show the connectivity like Simo asks.
I read the Visio file Path_Analysis.vsd sample VBA code.
Presumably I need to populate the data in module modDrawData with the data from the actual visio GUI objects.
Are you aware of any code that can do this already?
Have a good New Year
Thanks for your help
Paul
System analyst
ps. I’m not a programmer.
Hi!
I am an end Visio 2007 user.
I have this need: In a very large diagram with lots of connected shapes, when double clicking a certain shape, I need a zoom view window that shows that specific shape in the middle of the window; the shapes that located at left of the whole drawing that are connected to it, in the left side of the zoom window; and the shapes that located at right of the whole drawing that are connected to it, in the right side of the zoom window. Is there a tool to do that? Is there a way to do that or a person who can do it?
Thanks.
Hello Visio Guy,
for some time i`m walking through this topic “path analyse” and i cannot find and lets say it “a user friendly” solution for this.
I`m not really good at coding, and when i started to look around the code – i got lost.
Is there a way to draw the graphic by hand – use connection points and so-one (i was looking at ConnectedShapes and GluedShapes API methods but it seems something is escaping me) , select to ends of the drawn net and visualize the shortest path between them…
I went through all the internet, and i cannot find a simple visual solution… 🙁