A lot of Windows users do network-related stuff with Visio. And for you hard-working folks, life just got a bit easier!
Microsoft just released a nifty add-in for Visio 2007 Pro that lets you utilize rack-server data from Excel or from the user and create Visio diagrams that make analysis a snap.
Update 2018.01.24: I’ve updated the download link for the Visio 2010 version of the add-in. I haven’t found a version for Visio 2013 or 2016.
In true Microsoft fashion, the tool is burdened with one of those rolls-off-the-tongue titles: Microsoft Office Visio 2007 Professional Add-In for Rack Server Virtualization (Virtual Rack). I live in Munich, where long titles and big words are a way of life, so stuff like this just makes me grin and wonder if the Germans are running the show in Redmond (or maybe lawyers?)
What Does Virtual Rack Do?
Anyway, the rack-server virtualization add-in allows you to plan for the consolidation of hardware by allowing many virtual servers to run on one physical server. This can reduce hardware costs, energy costs and increase flexibility. You’ll be able to visualize how your system will look before and after the virtualization, with clear pictures that highlight space-savings and power consumption
What Do You Get?
The download site provides a handy 51-page user guide in both Word (.docx, 3.7 MB) and Adobe (.pdf, 2.1 MB) format, as well as the COM Add-in installation files (4.0MB). The setup installs a COM Add-in that loads with Visio, along with a custom Visio template to help you get started.
I took a look at the documentation and thought I’d relay some highlights before sending you along to Microsoft.com.
What Do You Need?
First, the software prerequisites. You’ll need the .NET Framework 2.0 & 3.0, plus Microsoft Office Visio 2007 Professional. It looks like the solution uses the new Data Graphics and External Data linking features, which aren’t part of Visio 2007 Standard, so make sure you’ve got Pro.
Virtual Rack Add-in Details
The setup installs a new Rack Server Virtualization template that you can choose in the Visio startup pane. So it’s quite simple to get started.
Once the template is loaded, you’ll get a custom “Virtualization” toolbar and main menu item. These help you to quickly access the advanced functionality provided by the add-in.
After that, the workflow seems to go like this: choose/import data, configure data updates, create an overview diagram, drill down into individual racks, and finally analyze for improvements.
The actual functions that you’ll get see in the new menu and toolbar are:
Configure – To configure CPU utilization and logon credentials.
Import Data – To import data for analyze through various means.
Analyze – To retrieve server, rack and colo data.
Virtualize Rack– To virtualize the existing rack servers depending on CPU usage, power rating etc.
Status Window – To see the status of Analyze.
Help – User Guide for Visio Add-in for Rack Server Virtualization.
An Excel template is provided to help you massage your data into a format that can be consumed by the tool, or you can use the Wizard to help Visio map worksheets and fields from your own spreadsheets.
You can also enter data manually, but MS had the foresight to allow you to save the data–once entered–to Excel so you don’t have to re-enter anything.
The data that is needed by the add-in is broken into three categories: server, rack and colo (co-location). Each category then uses the following fields:
Server Data Fields
- Network Name
- Power Rating
- Space Used
- Rack Name
- Colo Name
Rack Data Fields
- Rack Name
- Power Rating
- Max. Units
- Colo Name
Colo Data Fields
- Colo Name
- Max. Units
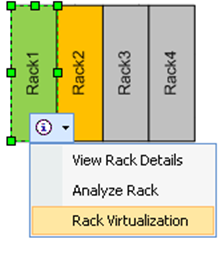
The add-in will draw overview diagrams for each colo in your system:

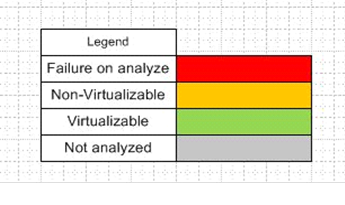
A color-coded legend will help you make sense of what is shown in the diagram:

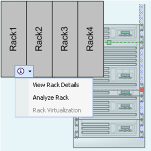
From there, you can drill down into each rack by creating detailed diagrams.
Before you start the analysis, you configure how data is fetched. Using WMI queries, the add-in can get current CPU utilization, or the Operations Manager SDK can be invoked to get CPU utilization over time.
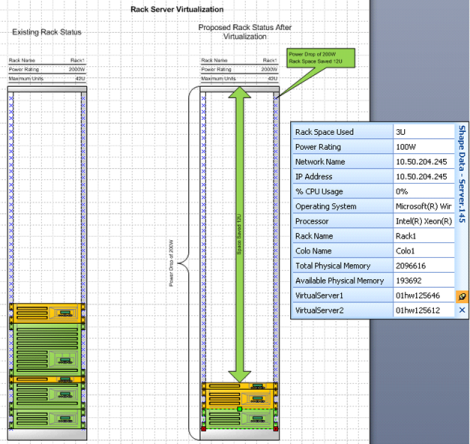
The add-in will then create before and after views of your racks. Here we can see that power savings in the green balloon, and the space savings, clear as day:

With companies looking to save money on hardware and go green by reducing energy waste, I imagine this tool will be quite helpful. And the visuals will certainly make the decisions easier to make and more convincing at that!
Download “Rack Server Virtualization Add-in”
details.aspx – Downloaded 8483 times – 175.00 B


Find Introductory and How To video’s on the site.
Video Demonstrations:
The Visio Effect – System Center Operations Manager Part I
How It Works – System Center Operations Manager Part II
I have been in this busines 20 years and virtualization is one of the most exciting things I have seen lately. I have talked to many people who have had success and others that don’t feel it really worked for them. It will be interesting to see the results in a few years.
Can this add on be used to generate diagrams using Stencils of Dell Servers (Rear View) to show the cabling betweer each server and rack? I have to doccument servers, switches, tape libraries, router and San devices. We would like to be able to see each port that is occupied and when it is terminated.
Paul raises some common (though still with a high degree of interest) questions.
“Can this add on be used to … using Stencils of Dell Servers (Rear View) to show the cabling between each server and rack?”
The add-in uses generic stencils supplied by MS. This obviously eases their process and helps ensure a degree of consistency in the drawings. Short answer no.
“generate diagrams” This is ‘wish four’ from a lot of professionals (follows mirror data, drawing as input, interact with devices). There are a lot of things here, among them capture of data. Worthy of a blog on somebody’s site. The pre-reqs say WMI gathering which means a lot of stuff falls off the end of the world. Right now I use a RYO application for documenting. Short answer on MS stuff and then maybe a lot of work up front.
“I have to document servers, switches, tape libraries, router and San devices.”
Your list goes well beyond “dell” as a requirement. As an IT professional, users ask us for solutions that are “Good, Cheap, and Fast”. What we are paid for is to let them know they only get two out of three. Our firm (Altus Technologies) does datacenter re-lo’s so we have to use stencils that are not generic. For us that meant using Altima’s stencils. In some cases you can get them from http://www.visiocafe.com. Generally their NetZoom product will meet a lot of documentation requirements.
hth,
al edlund
I think this is a great idea, but I’ve installed it twice now and I’m still unable to get the new menu or toolbar. Any ideas why not?
Running Visio Pro 2007 on a Windows 7 laptop.
I had the Add-in under File/New/Getting Started/Add-ins, and I clicked Create. I can see the Rack Server Virtualization shapes on the left, but that’s all.
Any help would be appreciated!
Nice visualisation…
It’s really a cool and helpful piece of info.
I am happy that you simply shared this helpful info with us.
Please keep us up to date like this. Thanks for sharing.
Is there a visio 2013 version of this Add-In? it looks great, but, so far, the latest versoin I’ve found is for Visio 2010…