 If you’re utilizing vector math for your graphics-related projects, this free download might help with your learning and understanding.
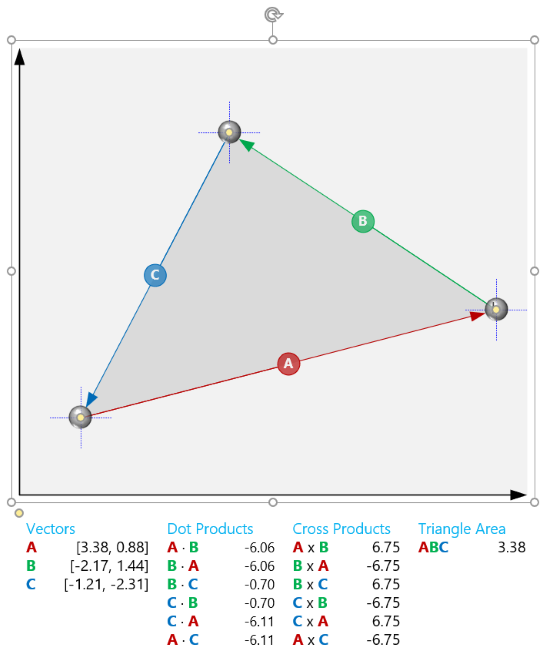
The downloadable Visio shape lets you visually manipulate the points that form a triangle, and see how the numerical data for the vectors that define the triangle change. You can see the vector data, dot-products, cross-products, as well as the area of the triangle defined.
Math is Hard!
I’ve been working on some projects that involve graphics in windows forms, WPF and SVG. More than once, I’ve needed to know if the mouse cursor was over a particular line segment. As I searched around, or tried to do my own derivations on the backs of napkins, I soon realized that Cartesian coordinates, and rise-over-run slopes are good ways to fall into a divide-by-zero pit of despair.
The best solutions involve vectors and cross products and dot products. And I found a few on Stack Overflow, as well as in Chapter 33 of Brian Hayes’ book Beautiful Code, which I wish I had more time to enjoy and read more carefully.
The problem with many of the techniques I found is that they calculated if a point was exactly on a line, and maybe exactly on a line segment. Further down in a thread, someone would (finally) chime in on how to make the calculation fuzzy by not testing for zero, but maybe testing for 0.1, or similar. But that fuzz-factor was never explained. Yes, a point is near a line as a cross product of some related vectors approaches zero, but how small a result equals close? What’s the tolerance of the tolerance value?
As I was thinking of how to test, or how to derive the extra information I wanted, it occurred to me that it would be fun to build a Visio shape that had some vectors that you could move around with control handles, along with a bunch of calculations displayed in the shape’s text.
So I’ve spent the evening working on this, and thought I’d share it with you!
The Vector Math Shape
User-wise, there’s not much to talk about. You’ve got X- and Y-axes. You’ve got control handles for manipulating the points. And you’ve got a bunch of text blocks at the bottom that show the numerical data for the graphics:
I hope my math is right. The dot products are the same for the likes of A · B and B · A. The signs of A x B and B x A are opposite. What surprised me is that all of the cross products for the sides of the triangle are the same. If you see something wrong, please let me know in the comments below!
You can show and hide the various text blocks, as well as the background shading for the coordinate system and the triangle itself. Just flip the Shape Data fields, or right-click and toggle items on and off:
If your points stray into other quadrants, the axes and background grow to accommodate. You can freely reposition the text blob, too!
Doesn’t do unit vectors. Maybe I’ll add it some day!
There are probably some other things I could add to the shape, but I have to sleep too. Perhaps:
- Show unit vector information and calculations
- Show the magnitude of the vectors
- Show the angles of the vectors
- [Paste Your Suggestion Here]
Get the Shape!
You can download the Vector Math shape here:
Download “Vector Math Shape”
s!Aj0wJuswNyXlhje_AGAPFGRCdJaL – Downloaded 2918 times – 103.00 B


Leave a Reply