The interesting problem of fitting words into arbitrarily-sized rectangular areas has been lurking in the dark corners of my D:\ drive for a while now. Today I decided to do something about it, and offer you a cool SmartShape to create interesting visuals with.
The area-filling text shape lends itself to creating Word Clouds and graphics that use text in a matrix- or tabular style.
Word Clouds
You’ve probably heard the term “word cloud” if you’ve spent any appreciable time on the internet. A quick image search on “word cloud” will yield results like this:
On closer inspection, you can see that the words in the clouds have quite a variety of sizes, orientations and colors:
Often the size and color of the words is intended to depict some sort of data–often the frequency of words in a book, paper, or politician’s speech. I imagine that these charts are generated programmatically, using some clever code and a data source, although some of the final positioning into clever shapes like Australia might be done by hand. I ‘m not sure about this.
But what if you wanted to create a simple one by hand? I think it would be a rather unpleasant process of formatting! Lots of clicks to change font size and color and, and, and.
Another problem that I see with lots of word clouds is that long words steal more visual importance than short words. This can distort the data-related message that the word cloud was trying to communicate.
Imagine that the value for “Bob” is 50% and the value for “Christopher” is also”50%”. If you make both words the same point size, then one of them gets a lot more visual weight: 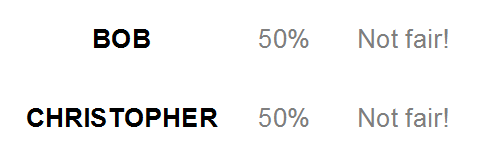
You can see one such example from the search results up above, where “application” and “user” have about the same font size, but one word is quite a bit longer than the other, and gets more “visual mind share”.
What if you could make equal-valued words occupy the same area?
That’s what I’ve done with today’s Visio SmartShape offering. Here’s our current example: You could argue that the stroke-weight of the characters in BOB is much greater than for CHRISTOPHER. Perhaps we’ve just flipped the problem in some ways. But I think it’s closer than when the long word is not squished. And hey, the new shape is pretty cool, and expands the possibilities of what you can illustrate and communicate visually!
Now I whined about doing the “normal” word cloud by hand, but creating this squished-stretched-equal-area style of word cloud would be even worse. You’d have to size the rectangle, size the font, then tweak the horizontal scaling of the font to get it to fit inside the rectangle. Phew! That’s a lot of work.
Aside: Adjusting the Horizontal Scale of Visio Text
Wait, did he just say “tweak the horizontal scaling of the font”?
Yes he did!
Believe it or not, Visio has a setting for squishing or stretching text characters horizontally. This feature is perfect for getting text to fit inside of an area.
You have certainly discovered several ways to increase and decrease the font size of text in Visio shapes, but stretching and squishing them is buried deeper in the more obscure Text dialog.
To get to it, you click one of the dialog box launchers located in the Home > Font or Home > Paragraph groups:
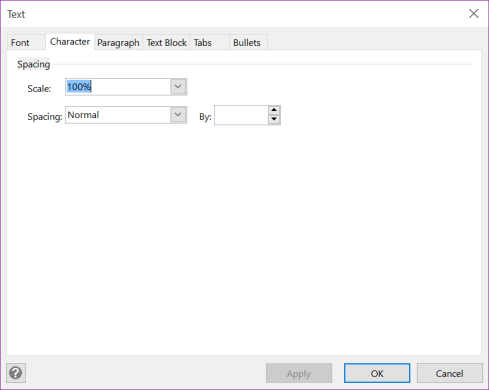
These teeny buttons will pop up the Text dialog, with its fabulous six tabs. If you can browse to the Character tab…
…you’ll notice the Scale field. Increasing the value fattens the text, decreasing makes the characters skinny. You can also leave the size of letters alone, and just increase or decrease the spacing between them using the Spacing control. But we won’t use the spacing feature today.
SmartShapes to the Rescue!
Meanwhile, back at the SmartShape…
To alleviate some of the tedium and über-clicking we would have to do to get text to fit in a rectangle, I’ve employed Visio’s Excel-like spreadsheet: the ShapeSheet to help us out.
Armed with a working knowledge of fractions, I was able to construct/program a SmartShape that resizes the text to fill any rectangle–as you type.
Just drop the shape on the page, type some text, pick a fill color and a font color, then resize the rectangle any way you want! Yes, you still have to do some clicking, but I find the process is much more interactive and feels like less of a chore.
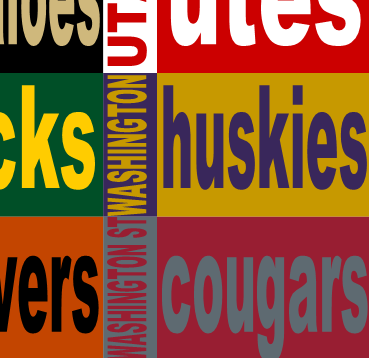
I created this sample graphic of Pac-12 college football teams. It’s not really data related (although I did assemble a teeny database of RGB color values using a Firefox color-dropper plug-in and this Wikipedia article), but you can see that this area-filling text concept lends itself well to matrix-style graphics: Here’s a close-up:
Adjusting the “Squish Factor” When Text Wraps
The shape’s internal logic has a bug, or perhaps it is a Visio bug, or maybe some sort of rounding error that occasionally causes text to wrap. It usually happens when a word is fairly long. Note the Washingtons at the bottom of this illo: 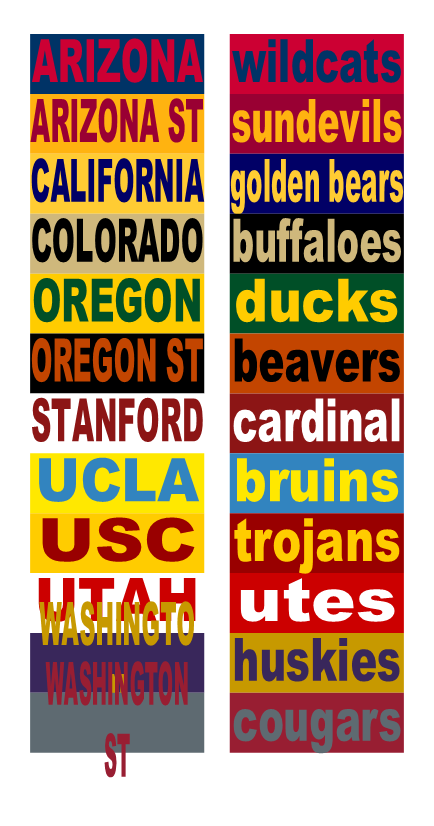 Whoops!
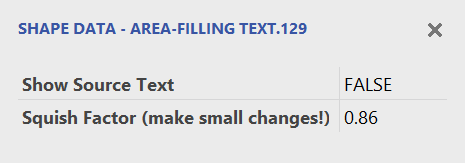
I wasn’t able to make the shape smart enough to always detect this wrapping. So instead, I built in a Squish Factor, and “exposed it to the user”. This means that you can adjust the value when you encounter an overrun.
Normally, this Squish Factor is the seemingly arbitrary 0.87. Changing it to 0.86 has fixed most occurrences of the problem that I’ve seen. You can change the factor using the shape’s Shape Data field:
I think that 0.87 makes the text as large as possible within the rectangle, so you don’t want to deviate too far from that value, if possible, or you’ll end up with too much space around the text.
But tweak we must, occasionally.
I’ve found that very small changes are generally enough to fix the problem. And to help you do this, I’ve added right-click options to bump the value up or down, so you don’t have to edit the value in the Shape Data window. In many cases of overrun, all I needed to do was right-click the shape, then choose Squish Factor Down by 0.01. Problem fixed. (OK, sometimes I needed to do it twice…)
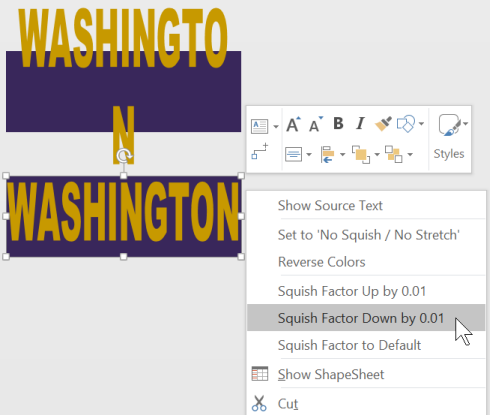 If, at some point you change the text to a shorter word, you can increment the squish factor, or restore it to the default value by also right-clicking the shape. Or just drag out a new shape. At any rate, staying close to 0.87 should get you the best area-filling of the text. Someday maybe I’ll revisit the problem and figure out if there is a better way.
More Features
There are several other features available in the right-click context menu. Here’s a rundown:
- Show Source Text
The text that stretches or squishes actually belongs to a subshape within the group. When you select the shape and type, you actually edit the group’s text, which is normally hidden in the lower-left corner of the shape. You can turn it on if it helps you to better understand what is going on, then turn it off when your graphic is perfect. - Set to ‘No Squish/No Stretch’
This expands the shape such that the text is perfectly unsquished/unstretched. I.e.: the font is in its unaltered state. Always a good starting point, and useful when you need to “step back and start over”. - Reverse Colors
I used this to create the state names from the team nickname shapes. It simply flips the fill color and the text color. If you’re a ShapeSheet geek, you will be in awe of how I was able to actually do this. Frankly, I just tried a few things until I got lucky. Feel free to open up the ShapeSheet and try and figure out what I did (I’ve already forgotten!) - Squish Factor Up by 0.1 / Down by 0.01 / to Default
We just discussed this in the previous section. Basically a workaround for when text wraps. It tweaks the math inside the shape to fix what is likely some sort of rounding error.
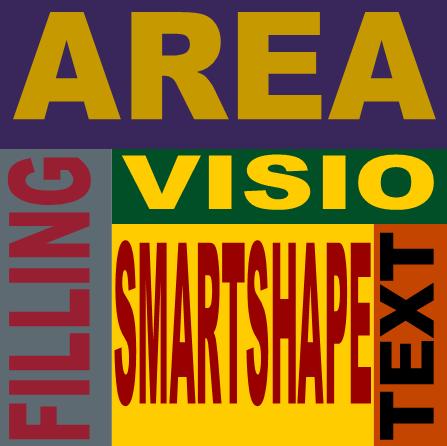
Here are the effects of these features, demonstrated visually:
 The last example shows the source text being edited. You can always double-click a shape, or select a shape and press F2 to get into “text edit mode”. When you do this, you will be editing the text in the lower-left corner, which is usually hidden. This can be a bit jarring at first, so be aware that you are editing hidden text, then the mathematical transforms are being performed by a subshape within the group. As far as I know, there is no elegant way to do this math on the actual text you type. You need some sort of normalized, “reference text” upon which to do calculations and transforms. Fun!
Last note: I developed this shape in Visio 2013. I’ve provided versions in the Visio 2003-2010 format as well.
Download “Area-filling Wordcloud Shape”
s!Aj0wJuswNyXlhDJzI4WW3Be9xrn- – Downloaded 2127 times – 103.00 BTODO:
- I haven’t tested the shapes in scaled drawings. If you find yourself needing this shape in an architectural plan, in a to-scale mechanical drawing, or other scaled drawing, leave a message in the comments below, or contact me.
- I have seen issues with color/formatting loss on copy-paste. My suspicion is that it occurs when the Format Painter has been used to color a shape. Need to do more research, but as usual, this is an as-time-permits endeavor (and time usually doesn’t!)
Appendix
Ok, since I’ve gone to the trouble of assembling the Pac 12 team color data, I might as well share it! So many folks are using data to do great things these days, it’s always nice not to have to clean it up yourself!
Source: https://en.wikipedia.org/wiki/Pacific-12_Conference
Pac-12 Team Colors as a Table
| School | Team Name | Color Description | Red | Green | Blue | RGB |
| Arizona | Wildcats | Cardinal Red | 204 | 0 | 51 | RGB(204, 0, 51) |
| Arizona | Wildcats | Navy Blue | 0 | 51 | 102 | RGB(0, 51, 102) |
| Arizona State | Sun Devils | Maroon | 153 | 0 | 51 | RGB(153, 0, 51) |
| Arizona State | Sun Devils | Gold | 255 | 179 | 16 | RGB(255, 179, 16) |
| California | Golden Bears | Blue | 1 | 0 | 102 | RGB(1, 0, 102) |
| California | Golden Bears | Gold | 255 | 204 | 51 | RGB(255, 204, 51) |
| Colorado | Buffaloes | Silver | 162 | 164 | 124 | RGB(162, 164, 163) |
| Colorado | Buffaloes | Gold | 207 | 184 | 124 | RGB(207, 184, 124) |
| Colorado | Buffaloes | Black | 0 | 0 | 0 | RGB(0, 0, 0) |
| Oregon | Ducks | Green | 0 | 79 | 39 | RGB(0, 79, 39) |
| Oregon | Ducks | Yellow | 255 | 204 | 0 | RGB(255, 204, 0) |
| Oregon State | Beavers | Orange | 195 | 69 | 0 | RGB(195, 69, 0) |
| Oregon State | Beavers | Black | 0 | 0 | 0 | RGB(0, 0, 0) |
| Stanford | Cardinal | Cardinal | 140 | 21 | 21 | RGB(140, 21, 21) |
| Stanford | Cardinal | White | 255 | 255 | 255 | RGB(255, 255, 255) |
| UCLA | Bruins | True Blue | 50 | 132 | 191 | RGB(50, 132, 191) |
| UCLA | Bruins | Gold | 255 | 232 | 0 | RGB(255, 232, 0) |
| USC | Trojans | Cardinal | 153 | 0 | 0 | RGB(153, 0, 0) |
| USC | Trojans | Gold | 255 | 204 | 0 | RGB(255, 204, 0) |
| Utah | Utes | University Red | 204 | 0 | 0 | RGB(204, 0, 0) |
| Utah | Utes | Black | 0 | 0 | 0 | RGB(0,0,0) |
| Utah | Utes | White | 255 | 255 | 255 | RGB(255, 255, 255) |
| Utah | Utes | Gray | 128 | 128 | 128 | RGB(128,128,128) |
| Washington | Huskies | Gold | 199 | 153 | 0 | RGB(199, 153, 0) |
| Washington | Huskies | Purple | 57 | 39 | 91 | RGB(57,39,91) |
| Washington State | Cougars | Crimson | 152 | 30 | 50 | RGB(152, 30, 50) |
| Washington State | Cougars | Gray | 94 | 106 | 113 | RGB(94, 106, 113) |
Pac-12 Team Colors as CSV Data
School,Team Name,Color Description,Red,Green,Blue
Arizona,Wildcats,Cardinal Red,204,0,51
Arizona,Wildcats,Navy Blue,0,51,102
Arizona State,Sun Devils,Maroon,153,0,51
Arizona State,Sun Devils,Gold,255,179,16
California,Golden Bears,Blue,1,0,102
California,Golden Bears,Gold,255,204,51
Colorado,Buffaloes,Silver,162,164,124
Colorado,Buffaloes,Gold,207,184,124
Colorado,Buffaloes,Black,0,0,0
Oregon,Ducks,Green,0,79,39
Oregon,Ducks,Yellow,255,204,0
Oregon State,Beavers,Orange,195,69,0
Oregon State,Beavers,Black,0,0,0
Stanford,Cardinal,Cardinal,140,21,21
Stanford,Cardinal,White,255,255,255
UCLA,Bruins,True Blue,50,132,191
UCLA,Bruins,Gold,255,232,0
USC,Trojans,Cardinal,153,0,0
USC,Trojans,Gold,255,204,0
Utah,Utes,University Red,204,0,0
Utah,Utes,Black,0,0,0
Utah,Utes,White,255,255,255
Utah,Utes,Gray,128,128,128
Washington,Huskies,Gold,199,153,0
Washington,Huskies,Purple,57,39,91
Washington State,Cougars,Crimson,152,30,50
Washington State,Cougars,Gray,94,106,113





I love this shape. but i can not copy and reuse the shape on other drawings..
what i am missing? copied the error message in visio 2013 down below for reference:
an error (318) occured during action drop
referenced cell pages[Sheet.4]!does not exist
how do i fix the issue?
Hi Shivadiv,
I see this error too sometimes. No idea what is causing it. But I am able to either copy the shape from the page and paste it into another drawing, or drag it from the Document Stencil onto another page. Try some different possibilities other than just copy and paste. Try starting a drawing in a different instance of Visio, or maybe adding the master to your Favorites stencil, as discussed in the article.
Hi,
Tried all things suggested.. no luck 🙁
Same result with the .VSDX vs. the .VSD files (2013+ format vs. 2010 and older file format)?
yes.
First of all,
Thank you Chris for yet another great idea and a very fun and useful SmartShape to play with!
I’m using VISIO 2007, and I run into the same error trying to copy/paste, drag to another document, save as SVG, or adding that master to “favorites”.
After experimenting some, I found that saving the file in VISIO 2002 format seemed to “break” whatever link there is to the mysterious Sheet.4, and then I could save as SVG. I haven’t tried anything else yet, but thought I’d mention it as it may help in using this, as well as tracking down the bug and fixing it.
[CTRL] [Left-click] [Drag] [Release] will duplicate those shapes, but it doesn’t fix the underlying problem.
Surrogate posted the code for a macro that will fix the problem.
http://visguy.com/vgforum/index.php?topic=7087.msg29799#msg29799
Apparently this can be a common problem if certain things are done with Visio shapes, groups, and masters.
I hope this helps, and Many MANY thanks to Surrogate for making this excellent one-click fix available!