 Visio has incredibly useful functions for slicing and merging shapes. But sometimes these shapes leave artifacts that can be a pain to clean up. Check out this simple trick to make it less painful!
Huh? What Was That Title?
First, thanks for being brave enough to venture past the cover page and find out what this article is about. If you’re interested in using maps in Visio, or creating custom shapes with complicated outlines, I hope it will be worth your while.
Creating and Destroying Visio Geometry
Visio has some nice, but little-known, functions for slicing and dicing shapes, as well as for assembling them back together. They are technically known as Boolean Operations, and you’ll find them on the Developer Ribbon Tab, in the Shape Design group, under the Operations drop-down.
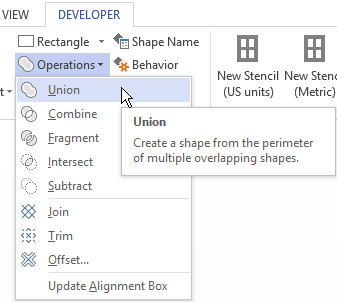 The top group, Union, Combine, Fragment, Intersect, and Subtract are focused on creating and destroying “areal” or closed shapes. The overlapping circle graphics show you how the operation either puts pieces together, or breaks them apart along the boundaries of the shapes you’ve selected. See how the circles are being sliced-and-diced, removed-from, or blended together?
The second group: Join, Trim, and Offset are more concerned with lines. You can join line segments together, or slice them into individual bits at their intersections. You can also create an offset to any path or curve you’ve drawn.
Note: it is common to use line segments to Fragment closed shapes, but the left over line segments disappear, so Fragment really is an “areal” operation. There is no operation that will preserve both line-bits and area-bits. It’s either Trim or Fragment, but not both.
My problem this morning has to do with a phenomenon associated with Union-ing shapes. So let’s back up a little bit to shortly after 6:00AM this morning…
Simplifying Maps
The customer I was talking to had this map of Alberta in bitmap form in her drawings. It had various zones that are meaningful to her business. But it was a fuzzy bitmap, and the regions were all part of one shape, so we couldn’t add hyperlinks to each part very easily.
I thought it would be a great idea to create vector-based shapes for each region. These would be not only nicer-looking, but they would be separate shapes that could support hyperlinks to corresponding pages in the document.
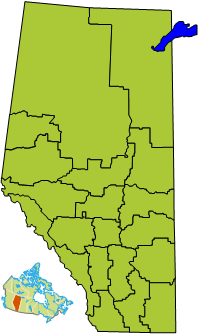
So off I went to the browser and searched on “Alberta Map Census Divisions SVG” (after first checking if they say “county” in Canada). I expected that someone would have uploaded a nice SVG rendering of something useful to Wikipedia.
Now, SVG stands for Scalable Vector Graphics, and is a bit of a standard vector format for graphics these days. Since Visio can import and convert SVG files, you can use SVG maps in your Visio drawings with very little effort.
My search found a page with graphics that looked promising:
After downloading the SVG file, I right-clicked it in Explorer, and chose: Open with > Visio. Visio was able to convert it without any problems.
I ungrouped (Ctrl + Shift + U) the imported shape several times until all levels of grouping were gone. I do this for two reasons:
- I want discrete shapes with no grouping.
- I want to check that there isn’t a doubling of outline shapes and fill shapes. This sometimes occurs with imported graphics, and is unnecessary in Visio, since a shape can support both line and fill formatting.
I then deleted the Canada-overview bit, and gave the remaining shapes a transparent red fill, with a white outline.
The transparency allowed me to accurately resize, rotate and reposition the SVG shapes over the bitmap, which I could see beneath. And the white outlines were easy to compare and contrast with those of the image. While there were many more divisions than regions, I could see that the borders matched for the most part, with the exception of a chunk around Edmonton.
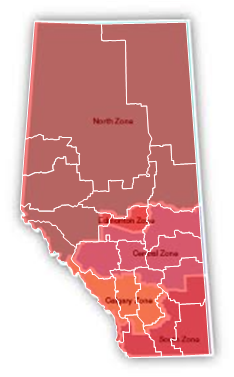 I knew that I could use the Boolean operation Union to meld many of the shapes together, then use Fragment to slice off a bit of one divison and give it to the Edmonton region.
Artifacts of the Union
It was a simple matter to multi-select the northern divisions using Shift + Click. I then quickly unioned them together using the key sequence: Alt + L, O, U. If you wonder how I know that, just start with Alt, then look at the little letters that appear next to ribbon tabs and controls. Once you’ve done something enough, it will stick in your memory, and you can work faster.
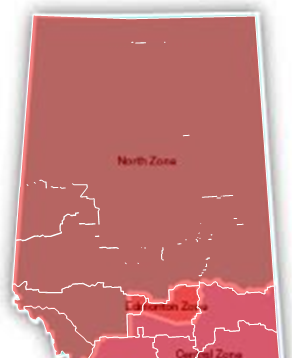
The result was this:
Well, you can see that the borders are gone for the most part, and it looks like one shape. But there are a bunch of leftover artifacts. Either math errors, or imperfections in the original outlines, or imperfections in the conversion have resulted in a bunch of line segments and paths littering my otherwise expansive, pristine North Zone shape.
This happens a lot with map graphics, in case you’re wondering. I’ve done a lot of work converting maps to something usable in Visio, so in case you’re wondering, this kind of problem is not necessarily out of the ordinary.
So how to clean this up? Well, you can delete these bits by clicking the points using the Pencil or Line tool, then pressing delete. But it’s a lot of work!
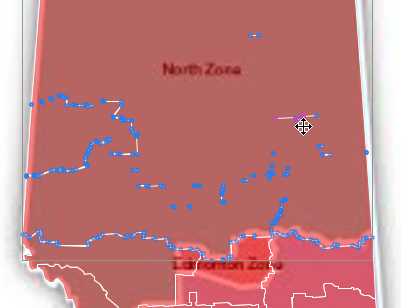
Below, I’ve selected the shape using the Line tool, and you can see that there are actually a LOT of vertices! Yes, you can Shift + Click a bunch of vertices, then delete them at once. That saves some time…unless you miss a vertex, then all of the ones you’ve selected get deselected and you have to start over! Also, Visio 2013 changed the look of the points, making them very small, and having very bad contrast. In the picture below, I’ve actually Shift + Clicked 5 or 6 points, but they have this weird transparent magenta highlighting that you can barely see. They’re just above the crosshairs in the picture below.
Luckily, there’s a better way.
Use Union to Clean Up Union!
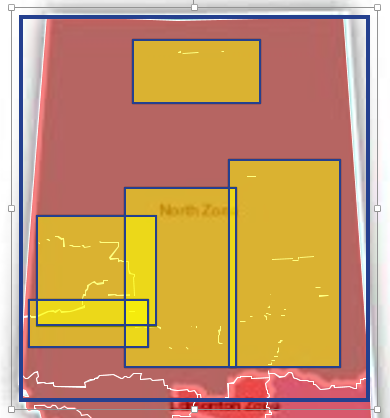
Since union melds shapes together, it occurred to me that I could effectively “spackle” over all those dots with big, fat shapes. So I gave it a shot. I drew a bunch of orange rectangles over all of the artifact lines:
Then I selected all of the shapes and Alt + O, L U-nioned them again.
Voila, and hurrah for Boolean logic! Evidently:
The union of a blob and a bunch of dots contained within it, is thankfully a blob.
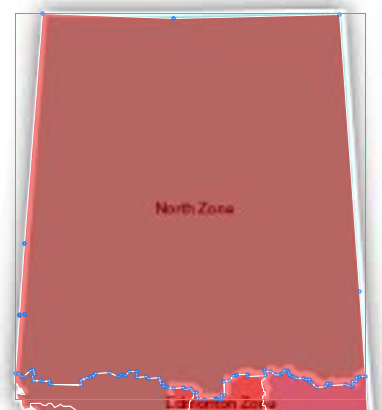
Our North Zone is now looking much better:
There might be one or two stray vertices that I’ll still need to delete using the Line tool, but this was much, much faster than clicking on every point individually!
Other Notes
A few other things occurred to that I’ll share before signing out. I’ll add them as errata here below.
Controlling Resulting Formatting
When “operating Boolean”, you can preserve the formatting of the result by clicking the shape that has the desired formatting first, then shift + clicking the other shapes that will be included in the operation. So I clicked the red shape first, then selected the orange rectangles before doing the union-cleanup operation.
Fixing the Edmonton Zone with Fragment and Union
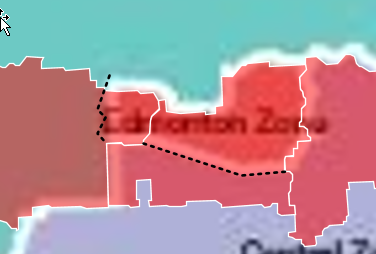
I mentioned adding a bulge to the Edmonton in the center. I won’t go into too much detail, but maybe you can see that it’s not too hard to draw a few “slicing lines” to chop the divisions up. Then the bits can be re-unioned to create appropriate zone shapes.
Here you can see I’ve created black, dashed lines that will be used to cut up the divisions:
Tool Shortcuts
If you find yourself doing a lot of this work, you’ll be switching between the Pointer tool and the Line or Pencil tool. These keyboard shortcuts might help you to do this more rapidly:
- Pointer tool: Ctrl + 1
- Pencil tool: Ctrl + 4
- Line tool: Ctrl + 6


Leave a Reply