 If you love Sankey Diagrams like me, you’ll be interested in how one Visio Guy reader created a very sophisticated flow using simple techniques.
He did it all in Visio, and the result is pretty impressive!
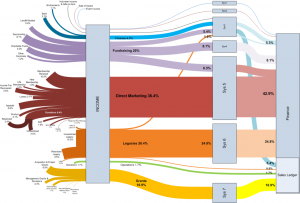
Visguy reader Chris Webb works for the Woodland Trust, which “is the UK’s leading woodland conservation charity”. He wanted to show people in the Trust what systems were being used for receiving specific types of income.
The result of Chris’ hard work is this attractive specimen:
click to view larger image
This tale is a bit of a data-visualization success story. The brownish-red colored stream represents the income that goes through the CRM system. Once the diagram was finished, Chris showed it to fellow employees. It surprised a number of people here and helped them to focus on it’s importance. Chalk one up for diagrams-as-valuable-tools!
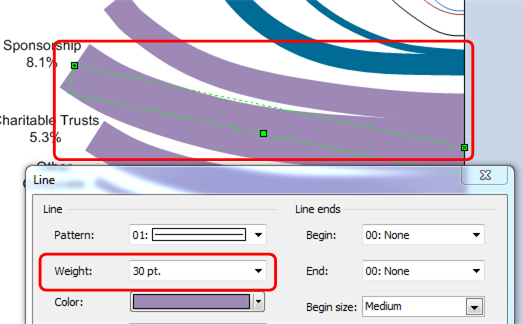
Chris didn’t use any of the fancy Sankey diagram shapes that we’ve talked about and shared on this web site. Instead, he made clever use of line thicknesses to create the diagram.
Here we can see that the “Sponsorship” flow has an ample line-thickness of 30pt.:

The biggest flow in the diagram is the “Direct Marketing” flow, which has a whopping 146pt line-weight!
By simply using the Format > Line dialog to make flows thicker and thinner, he could then use lines of any shape, including the smooth, flowing curves that you see in the diagram. I like the gentle curves in this diagram, and he a very nice use of color to distinguish different families of flow, yet still make an attractive diagram.
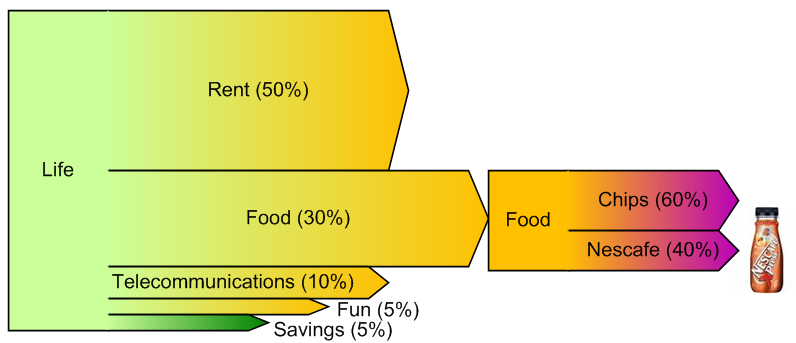
In contrast, shapes like those in Pre-wired Sankey Diagram Shapes, are (still) very limited in their geometry: they only do “straight arrow”. But, they have outlines, support gradient fills, have user-specified head and tail shapes, and are data-driven to some extent:
As usual, with Visio there are several ways to get the job done. So if you need fancy formatting and black outlines, then maybe the straight, Visio Guy shapes will work just fine. But if you need flowing curves, then Chris’ line-thickness technique is definitely the way to go!
Download “Follow the Money Sankey Diagram”
s!Aj0wJuswNyXlhnviAzkDvrmT9SBN – Downloaded 9478 times – 103.00 B


Great visuals! This is a pretty good way to get a fluid Sankey diagram. It gets me thinking about new ways to make this easier. Just thinking out loud, I wonder if this technique can be combined with the new List capability in Visio 2010 to good effect. Perhaps a Visio Guy reader will beat me to the working example.
Wow, this was excactly what I was looking for. Didn’t know about sankey diagrams before.
Chris, many thanks for the time and effort put into this diagram!
Marco
Really impressive work! It needs a lot of patience to do this! I really like the design and colors used.
Just love it
Egide
I am very glad this has gone down well with some. The thing that’s missing for me is any real feel for the direction of flow. We all know it’s left to right, but it’s not indicated in the diagram. To make this work for more complex flows (circuits) I have found that copying and pasting a thick line on top of itself and then formatting the top version to be a ‘wire-frame’ style arrow works pretty well. It breaks down when the lines get too narrow.
Thanks for a great example of making complex data simple.
Wouldn’t it be great if you could use something like this to report from a database – there’s something intrinsically understandable about this diagram that would take many more bar, pie and flow charts to acheive.
This really looks nice! In regards to the Left to right flow, I noticed that if you turn on the “end point” arrows, they point leftward in some instances. The shapeText also points right to left. The only reason that I mention it is that the Wingdings font provides some arrow shapes as text characters. If you scale the text size to fit the line and set the transparency/ select the correct font shade, then they aren’t that big of a distraction and portray the linkage and flow that you are talking about.
If you mix the methods associated with text along connector shapes, then you can direct the arrow with the same curve of the Sankey line which looks nice.
FYI, there are many arrows, but I found Wingdings #240 to be suitable.
Does anyone think that there is merit to the concept of a glue contour line that has connections points at strategic locations for each Sankey line to make an attachment? I’ve read some of the randomization blogs and with some Bezzier curves and some math, you could achieve a fluid connection boundary. The contour would also serve as a nice point to justify/angle the text associated with the line.
Hi Visio Guy,
I just uploaded a brand new online Sankey Builder. Upload data, configure via a wide range of tools and save. It allows you to drag and drop fields from your data to customize the Sankey Flow and dynamically add Filters on any Field in the diagram to squeeze the data. Has automatic highlights of bands across the diagram to highlight data relationships and you can even mix and match colors. Automatic Paging for large data sets! A Sort feature by value or field in ascending order. All settings can be saved for a future visit. The tool includes a Share feature which allows you to enable or disable any of the settings. The unique URL created by the tool allows you to distribute the Sankey Diagram to visitors for a read-only interactive version of Sankey Builder! Check out the demo (see below). You can even build a Free Sankey Diagram which is hosted for free. Simply visit HeatMap.ca and signup (all you need is an email address). That will get you access to SankeyBuilder for free. Demo: http://sankeybuilder.com/sankeybuilder.aspx?url=bbe34d97f8 and Tutorials are at http://sankeybuilder.com
Let me know what you think?
Rob
Thank you so much.
Hi Visio Guy – love your work – I know it’s been a while since this thread was live, but it seems the download links for the Pre-wired Sankey Diagram Shapes and the “Follow the Money” Visio Sankey Diagram don’t seem to work – could you get them working again? Many thanks!